Search This Blog

Sunday, May 5, 2013

PM_ATR_BarColor Strategy for NinjaTrader


PM_ATR_BarColor Strategy for NinjaTrader

The last changes on the ATR_BarColor Indicator have been defined after testing several automated instances of variations on the logic.
The final result is the PM_ATR_BarColor_v2 which is now ready to the public.
Note : The version 2 refers to the indicator version it is using.

This final release of the PM_ATR_BarColor Strategy has the following features :

  • User defined Target and Stop
  • User defined Time to Start and Time to Stop
  • Auto Exit of Positions at Neutral ( Yellow ) State
  • Money Management Module

The Auto Exit Feature allows to use Big Targets, and the system will get out at first yellow signal, where a possible reversal can happen.

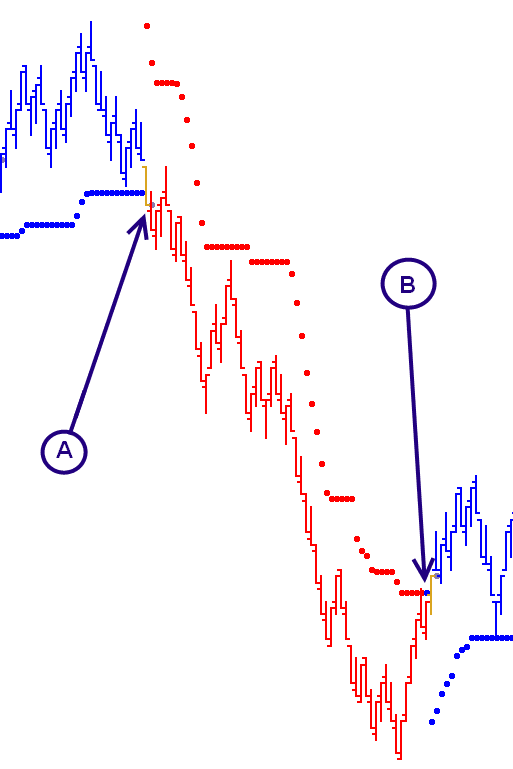
Example Chart with all debug info turned on ;
  • Vertical Lines at Entry signals
  • Markers of the Upper, Lower MutiTrail Lines
  • Text info after each trade ; xxx/yy where xxx is current daily PnL and yy is the consecutive loser count. On this chart we can see the last trades shows a positive $500 daily profit

The Money Management Module allows to stop trading for the remainder of the day if one of the following levels are reached :
  • Max Daily Profit
  • Max Daily Loss
  • Max consecutive losers in Row


This is the daily performance report of last week :

The input parameters that we need to optimize for each instruments are just a few, so it will not take too much time to get a good working configuration :


This is the Performance Report for an example configuration on CL


 You can take a look at the strategy in action on this YouTube video


Please feel free to post any comment or suggestion here...


logo Pablo Maglio The Indicator Store 
Facebook Twitter LinkedIn Blogger Elance

TIS_ATR_BarColor Indicator for NinjaTrader Update


TIS_ATR_BarColor Indicator for NinjaTrader Update

Since the release of the ATR_BarColor Indicator ( see previous post ), I’ve been experimenting changing some parts of the logic and adding different conditions to improve the performance of the signals when trading this indicator as an automated system.

Lets make a review of how this indicator works ;
As we have described before, we are using a well known trailing indicator, known as SuperTrail, SuperTrend, MultiTrail, etc as a complete trading system, with entries, exits and reversals.
On the following example we can see the standard TIS_MultiTrail Indicator showing an up trend ( blue bars ) changing to a down trend ( red bars ) when the lower blue multitrail line is broken. The bear move finishes when the red upper multitrail line is broken.
Used as Trailing stop, we exit the Long position on “A” and exit a Short Position on “B”.
If we want to use this Indicator as Trade Setup, now we need an entry signal. The most obvious entry is the same signal we use as exit ; for example we enter Short closing the Long at “A” and then close the short while entering Long at “B”.
This is a valid setup but it would be always in the market reversing positions, having very good winners while market moves, but the performance on sideways markets would be low, producing lot of reversals with small loses on each.
That was the reason of the creation of the ATR_BarColor Indicator, which adds a Neutral State ( yellow bars ) after each trend change.
After a Neutral State, it is required to break a pivot to produce an entry signal.
The old version of ATR_BarColor used fixed strength pivots of 1 bar length, while this new version ; ATR_BarColor_v2 has user defined pivot strenth.
We can see the effect on changin the pivot strength on the following pictures.

Using a 4 Bar Pivot


Using an 8 Bars Pivot
     

Another change in the logic includes a Fast Move Detection avoiding to wait a pivot creation when the trend change is fast.
This example shows a fast transition from Red to Blue with only 1 yellow Bar :
On this example the first Long signal happens at the close of the first Blue Bar.

The updated version of this indicator for Ninjatrader can be found on this link.

Please feel free to post any question or suggestion here...

logo Pablo Maglio The Indicator Store 
Facebook Twitter LinkedIn Blogger Elance

Saturday, April 13, 2013

PM_EMA_Bouncer Strategy for Ninjatrader Update

EMA Bouncer Strategy for Ninjatrader - Version 2

We have added a New Configuration to the Bouncer Strategy to allow for New Possible Setups.
The classic use was waiting for price to reach an envelope around a moving Average to be Trade Ready.
Then the trade was in direction to the EMA, and the entry was a Stop order placed somewhere between the trigger envelope and the EMA.
On this new version We are including a possible entry at a bigger envelope than the Entry


On this configuration, the entry order must be limit type.
After a Fill, the strategy waits for a reset before taking new entries.
On these example pictures, the green line is the trigger line.
The yellow line is the entry line.
If the market is impulsing, on a free fall or upside move, after having a loss, the strategy will wait for a reset as shown on the following picture :

This configuration can be used together with the classic style of stop entry above the trigger line :

On this example we can see the firs Long was a limit entry at the yellow line, the second long is a buy stop at the entry envelope

A short YouTube video showing both strategies trading together : http://www.youtube.com/watch?v=7n3kw_U5aAc

Please post any question or suggestions,
Regards,
Pablo
logo Pablo Maglio The Indicator Store 
Facebook Twitter LinkedIn Blogger Elance

Thursday, April 4, 2013

SRS Strategy for NinjaTrader Webinar Recording

This is a Ninjatrader Webinar recording about the SRS ( Small Range Setup ) 

YouTube Webinar Recording


logo Pablo Maglio The Indicator Store 
Facebook Twitter LinkedIn Blogger Elance


Tuesday, April 2, 2013

SRS Indicator for Ninjatrader for Trend and Counter Trend Setups

SRS Indicator ( Small Range Setup ) for NinjaTrader

This Setup, and its associated Indicator and Strategy, were designed to Trade in the direction of the trend ;

A Fast Period for the Envelope, a Slow Period for the Moving Average is the classic Setup that shows Red Bars when trending down, with orange diamonds indicating Sell Stop Entries at each small pullback ;


I have used this configuration for years. But just a few weeks ago, after the automation of the Indicator and the release of the SRS Strategy and its use with the Strategy Analyzer allowed us to find New and really Interesting Configurations....

What if we make the Envelope Period slower than the Moving Average ?


Now we get counter trend Signals ! ... 

....but does it work ?

Well, the first thing we do with a strategy is Optimizing its Settings 
And when we set the limits of the periods to scan on the optimizer, there is no option on Ninja to specify something like "scan all envelope periods and all moving average periods while envelope period be higher than moving average"...
No, it will just test all combinations...
But my logic was; it doesnt matters ! the optimizer will just discard those undesired scenarios because of being unprofitable...


But the surprise was that for some particular Instruments like Gold or Crude Oil , the best Configuration are Counter Trend Setups !...

Both current versions of Indicator and Strategy are prepared to trade counter trend setups, but we have to take into account that counter trend entries are really fast. Using the Indicator is useful to identify setups but may be too fast for some people to place and adjust the entry orders.

The last version of the indicator has audio alerts and we can use the alert window where we can see all signals and entry price together ( if we have the SRS indicator loaded on several charts at same time ) :


The Strategy can be used on Trend and Counter Trend Setups, with single position management :

It can be configured to take multiple ( user defines the maximum position size ) entries :


Each entry is individual and has its own user defined stop an target...

And it can also be configured to take multiple entries managing the whole position as a single trade averaging the whole trade into a unique averaged entry with its user defined stop and target :


Hope this post has been useful and let you expand your trading opportunities...
Let me know if you have any question posting here or sending me an email.

Regards,
Pablo

logo Pablo Maglio The Indicator Store 
Facebook Twitter LinkedIn Blogger Elance

Monday, March 4, 2013

PM_EMA_Bouncer Strategy for Ninjatrader

New Setup : PM_EMA_Bouncer Strategy for Ninjatrader

Hello everyone, we have a new setup to share with you.
It is very easy to follow and can be considered as an "alternate version" of the PM_EMA.

The PM_EMA is a trending setup. On this blog you will find several posts about it.
We follow an EMA ( Exponential Moving Average ) and when price is far enough from it we are in Trade Ready condition. To measure the distance between price and EMA we use an envelope. The entry is a bounce at the EMA :


The indicator painting the bars on these pictures is the TIS_EMA_Trader_Indicator, so it paints bars according to the trend, while PM_EMA_Bouncers trade against it. So; 
  • Blue Bars = Sell Stop at EMA+Offset
  • Red Bars = Buy Stop at EMA-Offset
The PM_EMA_Bouncer Setup uses the exact same logic to trigger the trade ready condition but early and in opposite direction, so by definition it is a Counter Trend System


We can use an early entry that allows to take a profit at the EMA. A value near the half of the envelope looks like working very well. And the envelope needs to be a higher than on PM_EMA setups. On CL a value of 30 is fine, allowing a minimum target of 15 ticks.
The example ( Range 6 CL Chart ) is using a 20 ticks target with an early entry of 10 ticks. The envelope is 30 ticks

This way, when we have a PM_EMA Long signal, we can take a PM_EMA_Bouncer Short and take profits near the Long Entry.
On some other more volatile Markets like Crude Oil or Gold, where EMAs can not offer good support we can use a bigger target all the way through the EMA.

With the PM_EMA strategy using the correct offset entry, is possible to calculate the PM_EMA_Bouncer performance by switching profit with loss.
Unfortunately, it is not possible to optimize the settings, because it will find the best profitable values, and we are looking for the worst values on PM_EMA.
Executing an Optimization of PM_EMA testing a wide range of moving averages periods, we can export the results to excel and create a chart of PnL vs Period.
This way we can choose the worst Period and use it on the PM_EMA_Bouncer Setup.
On this video you will find a brief description of how to do such thing :


As I found this setup very useful and sometimes it is a good replacement for PM_EMA when we find a good losing setup on PM_EMA it is a good winner on PM_EMA_Bouncer, I decided to create a dedicated strategy to backtest, optimize and trade this setup.


The strategy PM_EMA_Bouncer can be found on The Indicator Store Market and is the perfect companion for the PM_EMA_Trader

Regards,
logo Pablo Maglio The Indicator Store 
Facebook Twitter LinkedIn Blogger Elance