Search This Blog

Friday, June 12, 2015

The Best Systems for Ninjatrader

The Indicator Store
presents...
 one of the Best Systems for Ninjatrader :


MARKERS lite is the beginners version of Markers Plus

MARKERS is an Indicator, so it allows to be used with Chart Trader enabled.

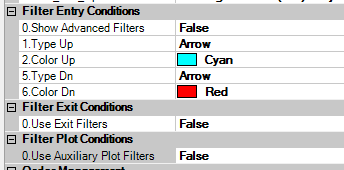
MARKERS detects Objects painted by your Indicator on the Chart ;
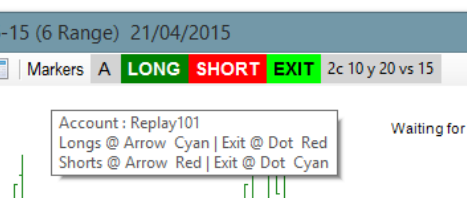
We can specify one object to Trigger Long Entries and another Object to Trigger Short Entries. It is possible to specify Colors for the Triggers Objects, so we can use same object but with different Color to Trigger a Long or a Short :

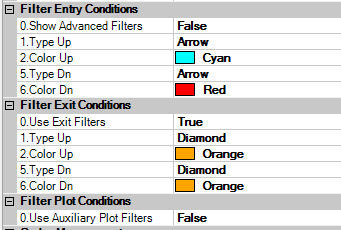
MARKERS can also be configured to Close Positions ( if any ) when a User defined Object is Painted :


Example : Markers Detecting a Red Arrow to Enter Short and a Yellow Diamond to Close Position :


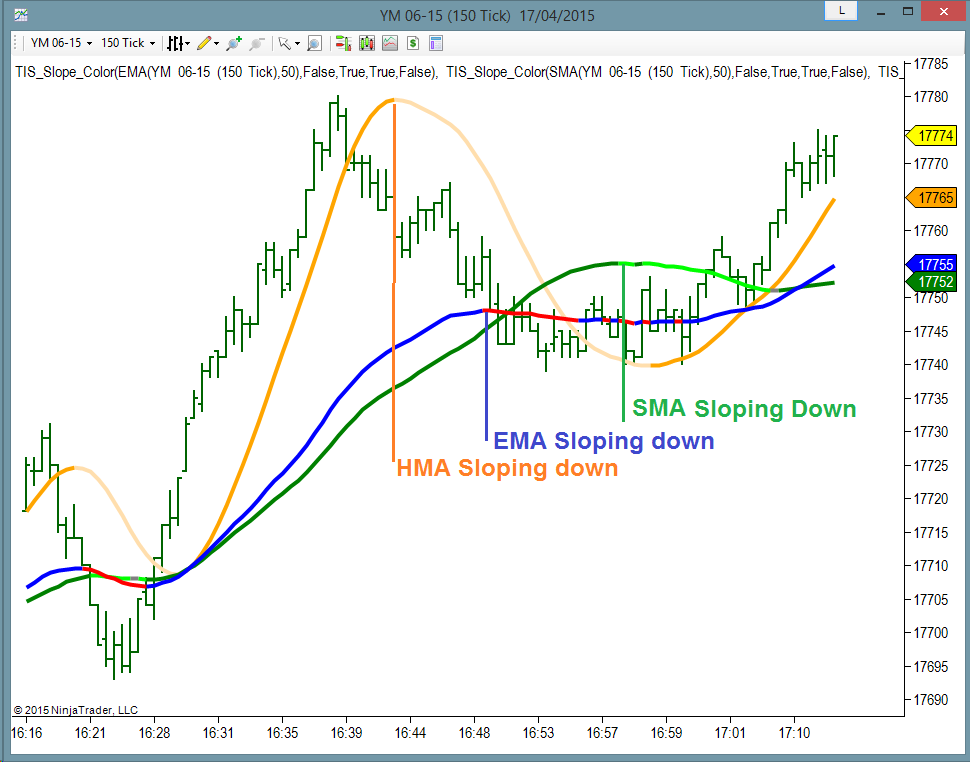
The Detected Objects can be Painted by any Indicator you own.

Markers Lite System can automate all your Indicator Signals, and auto trade all of them or you have the option to Enable Next Long & Next Short on a Semi Automatic Mode.

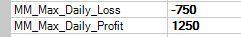
Markers Lite includes Money Management, so you can limit the Daily Loss & Daily Profit of your Setup

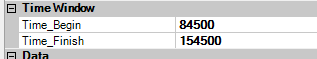
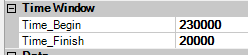
Markers Lite includes a User Defined Time Window; Only Signals detected inside this Time Range will execute Orders. Any remaining position will be Closed outside this Time Range. 

In other words, with MARKERS LITE it is possible to full Automate any Indicator Signals.

If you need more complex Trade Definitions with the Option to add Complex Trend filters, take a look at Markers Plus.
Take a Look on our G+ Channel Collections for Examples using Markers with different Trade Setups :


YouTube Videos Here :


Best Regards,
Pablo Maglio

photo
Skype Skype id : pmaglio
      

Saturday, May 23, 2015

New Markers Plus System for Ninjatrader

New Markers Plus System for Ninjatrader ( Markers v3 )

Hello Traders !

The New release of the Markers System, version 3 is now called Markers Plus, and includes lot of new features that let the trader create its own trade setup as we will describe on this post.

As explained on the previous article, Markers detects an object painted on the Chart and Executes an ATM Order if that object meets our criteria.
It is also possible to close a position if a particular object is detected.


Examples of Use


Going Long on a Cyan Arrow and Short on a Red Arrow


Same as before but Closing Positions at Orange Diamonds

It is possible to define a Time Trading Window ( useful for automating a setup )


Setting the trading time to trade only from 8:45 AM to 3:45 PM
( note that time is in 24 hours format including seconds : HHMMSS )


Settings to trade the night from 11PM to 2 AM


The Markers Plus System places a ToolBar on the Chart that allows the user to Enable or Disable Longs and Shorts, switching from automatic to semi automatic mode and selecting the ATM Setting


Markers includes also a Money Management Module to protect your Account and limit the Daily Loss and Daily Profit to the level specified by the user.


The New Markers Plus package includes the following tools to create user defined filters :


  • PMS_Markers_v3
  • TIS_Aux_Plot
  • TIS_Aux_Diff
  • TIS_Aux_Cond_And
  • TIS_Aux_Slope
  • TIS_Aux_Plot_Paint
  • TIS_Aux_XO_Marker


Added Features from last version (2.1) :

  • New Filter Using External Plots Conditions
    Any indicator with plots can be used to filter Longs and/or Shorts
  • New Auxiliary Indicators used as Condition Builder
  • Now Markers remind its buttons state even after a refresh
    If you add indicators to your Chart or change the settings of Markers or any other Indicator all Markers variables are retained ( as on v2.1 ) and also the button's state is restored ; no need to enable buttons again.

With the TIS_Aux_Plot Indicator it is possible to copy the values of any line of any Indicator present on the Ninjatrader Indicator List into an auxiliary variable.


For more info about the use of these Indicators please watch these ;


YouTube Videos :


Best Regards,
Pablo Maglio

photo
Skype Skype id : pmaglio


Saturday, April 18, 2015

Using the Slope of an Indicator to define the Trend

Using the Slope of an Indicator to define the Trend

One of the most used techniques to define the Trend of a Market is looking at the Slope of an Indicator.

Usually a Moving Average like HMA, EMA, SMA provide a good idea of the trend, having the first one ( HMA ) the fastest, and the last one ( SMA ) the slowest reaction.

On this Chart we can see an example of 3 Indicators using the same Period :


If we look at the Trend Changes, then the signals on each Indicator happens on the shown points :

We can even look at combinations of Indicators to define the trend.
For example, looking at a fast EMA to produce the quickest results may also produce too much signals, most of them not good, as we can see on this Chart :

Here I apply an HMA(8) to get the fastest response :

But to avoid so many signals, we can Average this line, using an EMA(8) of the HMA(8) and it looks like this :

On all type of moving average types, using a small period offers more response, less delay but more fake signals, so it is always a good idea to average the line several times using a small period ; Example : EMA(EMA(Close)) 

The Donchian Channel is also very useful, it has 3 lines : the upper, the lower and the median ( average between upper and lower ).

On this example I will use the Median of a 12 Bars Donchian:

These example Charts were generated with the TIS_Slope_Color Indicator for Ninjatrader, which allows to detect the Slope of any Indicator or combination of them as seen on this YouTube Video :


Hope you find these basic concepts useful to add or enhance your Trade Setups.

Please share and post any questions !

Best Regards,
Pablo Maglio

photo
Skype Skype id : pmaglio
      

Tuesday, March 31, 2015

Defining a Trade Setup using Crossovers with Ninjatrader

Hello Traders !

Today we are reviewing several Indicators that can be used to define a Crossover Trade Setup.

There are some Indicators that produce only one line, like EMA, SMA, HMA, etc.

Then we can use 2 Instances of same Indicator with different settings and check its Crossovers.

Examples : 

Crossovers of an EMA(14) vs EMA(7)

Note : The places where the Blue Line crosses above the Cyan Line there is a Long Entry Signal. Where the Blue Line crosses below the Cyan Line there is a Short Entry Signal.

On these type of Setups the Best Results can be obtained with faster Indicators like the HMA. 
The HMA produces faster and less lagged results as we can see on this Chart

Crossovers between an HMA(26) and an HMA(12) :

Note : On this example the Crossovers are indicated with Arrows using the Custom Indicator TIS_HMA_XO
The Entry Signals produced by the TIS_HMA_XO Indicator can be automated using the The Markers System.


Some other Indicators produce 2 lines like MACD, RSI, Stochastics, etc.
On those cases we can check the Crossovers of the 2 Lines produced by the Indicator.

Examples using 2 lines Indicators :

On this Chart we can see the Stochastic, MACD and RSI on the lower panes


Stochastic and RSI are Indicators that plot its lines in a defined range from 0 to 100, so we can define overbought and oversold zones.
MACD has no defined limit for its plots, so not suitable for overbought/oversold analysis but we can use it to trigger signals when the MACD crosses the AVERAGE lines as we can see on this Chart :

MACD Crossover ( MACD vs Average Line ) :


The Blue and Red Arrows indicate where the Macd crosses the Average Line.
These arrow signals can be painted by the Custom Indicator TIS_MACD_XO and automated using the The Markers System.

More info on this YouTube Video


RSI Crossover ( RSI vs Average Line )


As we can see the RSI produces a good amount of signals but it is very fast without lag. 
The values of RSI are limited between 0 and 100, so if we optimize its settings we can take only longs on the oversold area and only shorts on the overbought area. But the overbought/oversold level on RSI is not its best feature.
It should be used with some additional filter to select only Longs or Shorts depending on the trend. The trend can be defined by the last signal produced by some of the previously seen indicators, like the EMA's Crossover.
The Arrows signals shown on this chart are produced by the custom Indicator TIS_RSI_XO and can be automated using the The Markers System.


Stochastics Crossover ( K vs D Line )


The Stochastic has a very fast response and also a very precise determination of overbought and oversold levels so we can look at K vs D line Crossovers only on the OverBought and OverSold Areas.
On this example Chart, the  OverSold level is 10 and Overbought is 90, so a Blue Arrow ( Long Entry Signal ) is shown when K lines crosses above the D line and its was coming from below 10.
Red Arrows ( Short Entry Signals ) are shown when K line crosses below the D line and it comes from above 90.
These signals are produced by the TIS_STO_XO Custom Indicator. And the Entries can be automated using the The Markers System.

More info about this trade Setup on YouTube :


Hope you find these Trade Setup ideas useful for your use.
These are just simple pieces that we can use to create a more complex Setup.
As example, we can use any of the explained logic rules to define the trend, other to trigger an entry and then a different rule to trigger an exit.

Please post any questions, sugestions or ideas you wish to share...

Thanks and please share this post !

Pablo Maglio
photo
Skype Skype id : pmaglio