Search This Blog

Showing posts with label ENGLISH. Show all posts

Sunday, July 14, 2019

Rebote Setup : Market Bounce over a Moving Average

REBOTE SETUP

In this article I will describe another of the many ways to analyze bounces on a line, such as an exponential average.


In previous articles we saw the Setup EMA, which also consists in trading the rebounds of the price on an average, although the methods of defining the trend and then the entry method are different.


I will refer to the bounce line as the EMA (Exponential Moving Average), although the setup is valid for any line.


The concept of bounce is clear; If the price is above the EMA, we want to buy when the price touches the ema.


It only remains to define from what moment we start to be interested in buying, and then, in what way we enter the market.


In the Rebote Setup, I made the decision to count candles that are not touching the ema and that are also a minimum distance away.

Example :

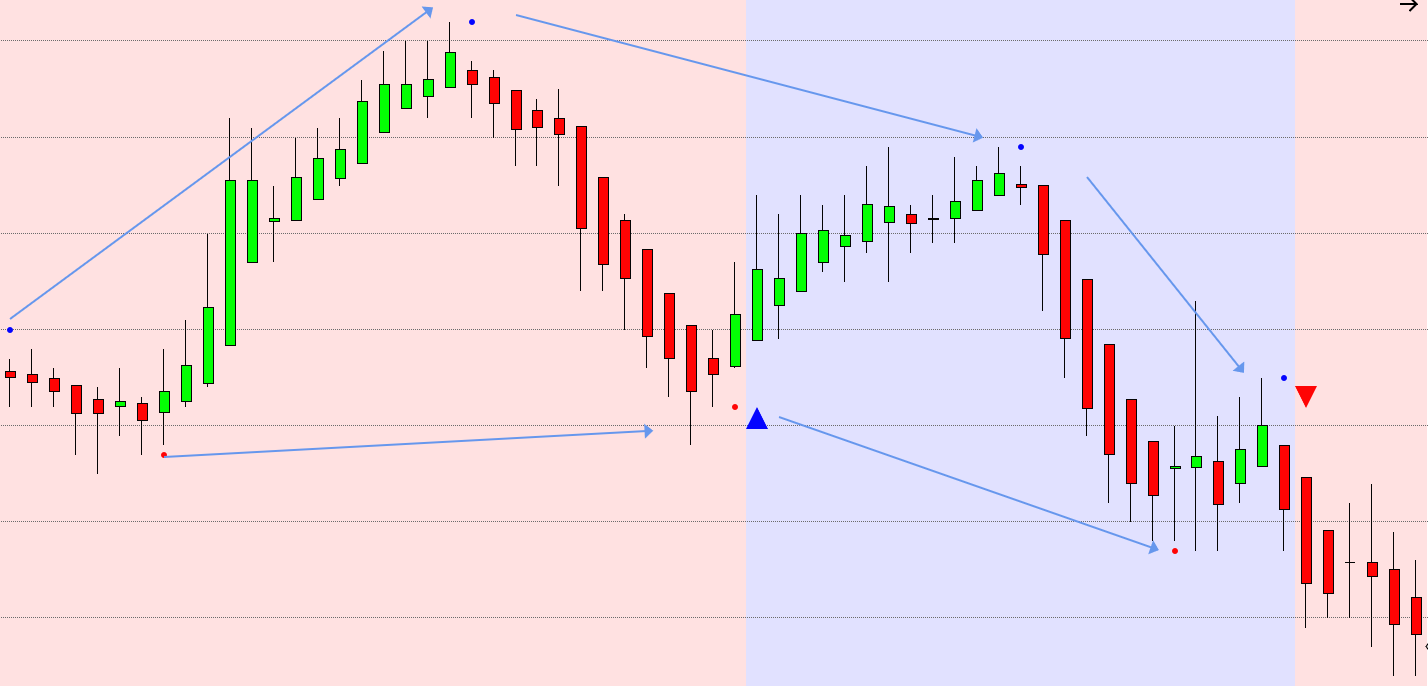
In this chart we look for the bars not to be touching the bounce line for at least 5 candles and as we see, not necessarily in a consecutive way.


Just at the fifth candle we have defined the trend and start looking for a bounce.

The dedicated indicator TIS_Rebote, paints the background with the color corresponding to the current trend and also paints the entries

Once the trend is defined, it does not reset, there is no need to recount, and entering the market at all the rebounds from that moment, unless there is a separation from the other side of the ema, in which case we start the count but for the trend in the opposite direction.

Note: It would be necessary to analyze if after the first signal (red arrow) it may be convenient to reset the count and recount N separation candles (this is not analyzed in the dedicated indicator)


Once we have defined the trend, we start looking for Entries:


In the case of a Long, we look for a candle that has a low below or touching the ema and a close above. It must also be a bullish candle for purchase (green)

Example :

This setup is intended to operate at bar close; without intrabar analysis or placing Limit orders; Simply entering the market at bar close.

The reason why I opted for this type of analysis is to be able to optimize parameters in the Strategy Analyzer and not have to worry about what happens intrabar. It is very easy also to review a chart by looking at historical data precisely because there is no need to know what happened while market was painting a candle or to estimate whether a limit order had fill or not.


This does not mean that we can not put the indicator or strategy to work in intrabar mode, although in this case we must take the necessary precautions when using the strategy analyzer, for example using Ninjatrader 8 with High Fill Resolution.


The dedicated indicator includes several visual and filtering options, allows to expose the trend and input signals to be used from other scripts, such as Markers Plus to be able to automate and / or filter signals. It is compatible with Fast Signals™ by Markers Plus for Ninjatrader 8.

It also includes a strategy created with the builder that allows generating reports and optimizing parameters according to the logic described above. It is open source so that the user can add or change options.


Link to Purchase Page


In this video you can see a description of both :


Wednesday, July 3, 2019

TIS_HMA_Crossover Indicator for NinjaTrader

The TIS_HMA_Crossover Indicator for NinjaTrader follows the Setup described on this video :
and it uses 2 lines :
  • A fast HMA
  • A Slow Linear Regression
And as many may think, we are not looking for the crossover between those 2 lines....no...

The Entry signals are produced by the HMA line crossing with a copy of itself, displaced 1 bar :

Here we have a chart with a fast HMA , using a period of 33 :


And now, we add another HMA, with the same period but displaced 1 bar using the displacement input parameter.
On this chart, it is in color blue :

If we look at where those crossovers happen, these are our entry points

Lets go to the results painted by the custom indicator TIS_HMA_Crossover, where the signals are the blue and red triangles : ( ignore the black line by now )


As we can see, we get signals where the red line changes its slope from trending up to down and so on...

Now, lets describe the black line ; it is a linear regression because its main feature is to remain linear, so its a good way to define a trend, given the last N bars.
We use the Black Line as a Filter ; when it is sloping up, we only take long signals, when it is sloping down, we only take short signals.

Here is an example, where we avoid the first 2 shorts because the black line on those bars is sloping up :


Something to take into account is the way to measure the slope.
I do not use angles, because the result is relative to the chart X-Y compression ; if we expand the X axis, the angle change...
I use something very simple, but effective : the slope of a line is the difference between the current value and the value 1 bar back.
To calculate that, we can use the Momentum Indicator, with a period of 1, and placing inside the input series, the indicator whose slope we want to measure.
And we get something like this :

We can see the relation between the slope of the red line and the histogram ; when the red line is flat ( horizontal ), the histogram is zero. When the red line is sloping down, the histogram is negative.
So we can measure the slope and get not only its trend, up or down, but also its magnitude.
Then we can define our filter to take longs when the slope is positive and bigger than a threshold, and take shorts when the slope is negative and below a threshold.
On this example, a threshold of 0.2 seems to work fine, because we avoid the long ( blue triangle ) but take the short ( red triangle ):


In a similar way, we can also specify a threshold for the Red Line, to avoid creating fake signals when it is oscillating on an almost horizontal state.
That way, in total we have 4 input parameters for this setup :

  1. Period of the HMA , the red line that creates the Entry Signals
  2. Period of the LinReg, the black line used to filter the entry signals
  3. Threshold for the HMA, to reduce the number of fake signals
  4. Threshold fo the LinReg, to define a consolidation are where not taking any trade
As we can see on the settings of the indicator we have these 4 input parameters:


And also the option to paint the background with the trend defined by the slope of the black line.
And as we can see on this chart, if we use a threshold different than zero, then we have 3 possible background trend colors ; trending up, trending down and no trending :


This logic can be easily implemented with the Strategy Builder on NinjaTrader 8 and the Indicator TIS_HMA_Crossover includes an open code strategy so you can edit the code, learn how it works, execute performance reports and modify the logic to create your own Setup.

Contact me for more info at Pablo@TheIndicatorStore.Com

Visit our Free Chat Room on Discord : http://bit.ly/TIS_Room


Pablo Maglio
photo
The Indicator Store
Skype Skype id : pmaglio
     
Risks


Monday, June 24, 2019

OpenClose Plus Indicator for NinjaTrader

What is the OpenClose Plus ?


This is an enhanced version of the OpenClose Setup with a special trend filter that improves the performance of the signals.

OpenClose is a configuration that is mainly related to the color of the bars.

Hence the name, since the color of the candle depends on whether the close is above or below the open.

For example, an OpenClose of 2 Candles, looks for 2 consecutive candles of the same color, as in this example:


If we look at these signals. they are identifying pivots; of maximums and minimums

Now, if we only paint those long signals where the last maximum is greater, and the last minimum is also greater than the previous one, we have the following signals:


We only have one long because the current minimum is higher than the previous one (the previous minimum did not break) and also the current maximum is higher than the previous one (the market has broken the previous maximum)

This is the filter of the New OpenClose Plus ...


We only have Long Signals if the minimum is sustained and the previous maximum was broken.

We only have Short Signals if the maximum is sustained and the previous minimum was broken.


The dedicated indicator TIS_OpenClose_Plus has this and many more options, both filtering and viewing.


For example, it is possible to paint the background of the chart according to the trend determined by each signal.

You can also get the trend from other indicators, from the builder or from Markers.

The signals can be copied with Markers Plus and used as Fast Signals.


Here you can see all its parameters:

As can be seen, it is possible to select the color of the signals.
If fast signals or arrows are used (Enable Plot Signals)
If the new filter is used (PLUS Mode)
If the color of common candle or HeikenAshi is used
If the trend is shown (to be used externally)
If the Background is painted
If once the trend is defined we give a number of expiration candles.
And then for each Signal; Longs and Shorts, we can define:
The number of consecutive candles that meet the conditions
Bar Up / Down sees the color (common or HeikenAshi)
You can also specify if the N candles must have Higher High, Higher Low, Greater Closing, Wick at the top, Wick at the bottom.
If signals are repeated, or only the first one is displayed, etc.


For more information you can see the following video:


Purchase TIS_OpenClose_Plus for NinjaTrader

    Pablo Maglio


Thursday, June 6, 2019

Markers Plus The Force for NinjaTrader 7 - Release June 2019 - English

June 6, 2019

The New Release of Markers Plus The Force for NinjaTrader 7 is Ready to Download on the Website !

All current Users can Upgrade ; just go to the Download Section on the Website and search for the File corresponding to Markers Plus for NinjaTrader 7


  • Download it to your desktop ( the file name is Markers_Plus_The_Force_1906.zip )
  • Remove your Current Version using the NinjaTrader Menu, File, Utilities, Remove Ninjascript.
  • Install this new zip module using the NinjaTrader Menu, File, Utilities, Install Ninjascript.


New Features

New Menu


  • With direct Access to the Account Selection ( optional if the user don't want it to be visible )
  • Direct access to the Manual, Semi, Auto Mode ( no need to click to cycle anymore )
  • Status shown on the ToolBar : The Force is Entering Long, The Force is Long, etc


Entry Offset

  • New References : Open , Close ,


  • Option to specify the bar used as reference from current to N Bars back


Text Objects as Entry Triggers
  • New Text match mode : Is_Contained

Indicators AND & OR
  • Logic easy to read from the Panels and Indicator List
    All the logic is visible and also the resulting variable


Sunday, April 14, 2019

VWAP - Volume weighted Price Average

VWAP - Volume Weighted Price Average

This indicator calculates the Average of the Price weighted by the volume of each bar.
That means that the value of this line is the sum of the average price of each bar multiplied by the volume of that same bar and finally divided by the total volume.

Now, depending on when we start counting the volume ( and also reset the count ) then we have different options for the Vwap.
The most used values are the 24 hs Vwap, where we count the total volume starting from the end of yesterday's session ( blue line ).
We can also consider only the day session, so start counting the volume at this time. ( red line )
And also we do the average starting the sum of the volume at the beginning of the week. ( green line )


On this video where I present the new release of the indicator TIS_Vwap for NinjaTrader 8 ( that also includes the version for Ninjatrader 7 ) I explain how it works an show some examples :

  • https://youtu.be/B4I4QsLoz5k


Purchase this indicator on our site : TIS_VWap for NinjaTrader

Best Regards, Saludos,
Pablo Maglio
photo
The Indicator Store
Skype Skype id : pmaglio
Risks

Thursday, March 14, 2019

Test & Automate Your Ideas with Markers Plus ‘The Force’

New Release of Markers Plus System : "The Force" 

Join Us on this FREE Webinar and Learn about The Force

Date: April 04, 2019 
Time: 4:15 pm ET 
Presenter: Pablo Maglio


Monday, May 7, 2018

TIS_NHABars


This indicator detects Bar Sequences with the following conditions :
For an Up/Down Signal :


1) N Up/Dn Bars
2) N BArs with a Higher/Lower Close
3) N Bars with a Higher/Lower High
4) N Bars with a Higer/Lower Low
5)
 N Bars with a wick at the Top

6) N Bars with a wick at the Bottom

The Bars are defined as Up/Dn Bars by their Color, which can be the corresponding to the HeikenAshi Smoothing or the Standard Color
.

This means that this indicator can also paint the classic NBars Signals.

Some other features :


1) Paint the background acording to the last signal detected
2) Adding a Plot with possible values of { +1 ; -1 } cording to the last signal, so it can be used as a filter
3) Option to add an expiration of the trend after a defined number of Bars.
4) Option to Repeat Signals on same direction.


Sunday, March 18, 2018

Automate Trading Signals


Hello Everyone,

Markers is a System ( an indicator ) that once applied to a Chart, can be configured to detect signals and execute an Order.

Example : We can configure Markers so when a Blue Arrow Up is painted on the Chart, a Long Order is executed.

That signal can be painted by any indicator or even by one of Markers Plus Tools.

Let say you have an indicator like Supertrend, it paint Arrows at each trend change :


With Markers you can convert this indicator into a complete fully automated system.

It is posible to define a time interval where to trade, a daily limit for losses and/or profits.

The system can also be configured to trade in full automatic mode or semi automatic mode.
On semi automatic mode, the user enables the next long and/or short signal and the system will wait for the signal and execute that order only.

The orders use the standard ATM configuration you already use where you can define multiple positions, each one with its own trade size, target, stop, trailing, break even, etc.

The orders can also be moved by the user without affecting the system.

Markers is available for both NinjaTrader versions ; 7 & 8
All current and previous users get both versions and all future upgrades.

Markers includes Tech Support  via TeamViewer or Skype Screen Sharing, so you dont need to worry about the learning curve ; if you dont know how to do something, just ask me !

Markers is available on 2 versions : Markers Lite & Markers Plus and it is possible to upgrade from Lite to Plus.

The main difference between both products is that Markers Plus not only detects objects, it can also create signals and filters.
Read more about the differences on this old post : Markers System - Tutorial #2

Not sure about something or have some questions ?

  • Fill this Questions Form (don't forget to ask about current discounts)

On this YouTube Playlist you will find more Markers related videos.


Best Regards, Saludos,
Pablo Maglio

photo
Pablo
​​
 Maglio
​ / 
Pablo@TheIndicatorStore.Com
The Indicator Store
Skype Skype id : pmaglio
      
Risks