Search This Blog

Showing posts with label New Indicator. Show all posts

Saturday, April 18, 2015

Using the Slope of an Indicator to define the Trend

Using the Slope of an Indicator to define the Trend

One of the most used techniques to define the Trend of a Market is looking at the Slope of an Indicator.

Usually a Moving Average like HMA, EMA, SMA provide a good idea of the trend, having the first one ( HMA ) the fastest, and the last one ( SMA ) the slowest reaction.

On this Chart we can see an example of 3 Indicators using the same Period :


If we look at the Trend Changes, then the signals on each Indicator happens on the shown points :

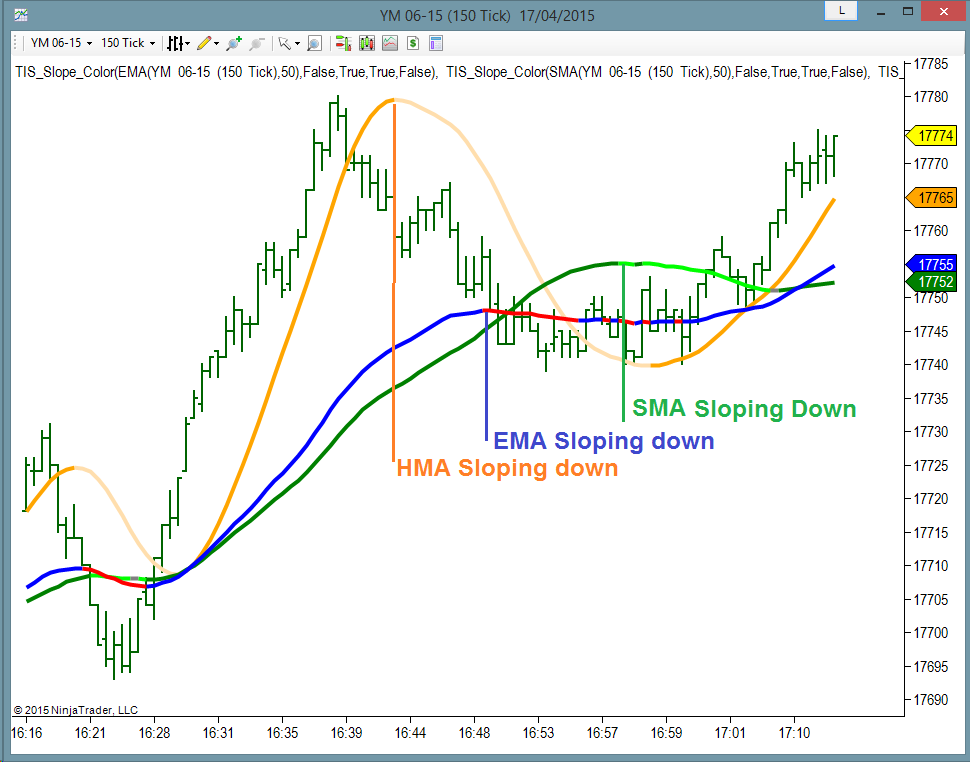
We can even look at combinations of Indicators to define the trend.
For example, looking at a fast EMA to produce the quickest results may also produce too much signals, most of them not good, as we can see on this Chart :

Here I apply an HMA(8) to get the fastest response :

But to avoid so many signals, we can Average this line, using an EMA(8) of the HMA(8) and it looks like this :

On all type of moving average types, using a small period offers more response, less delay but more fake signals, so it is always a good idea to average the line several times using a small period ; Example : EMA(EMA(Close)) 

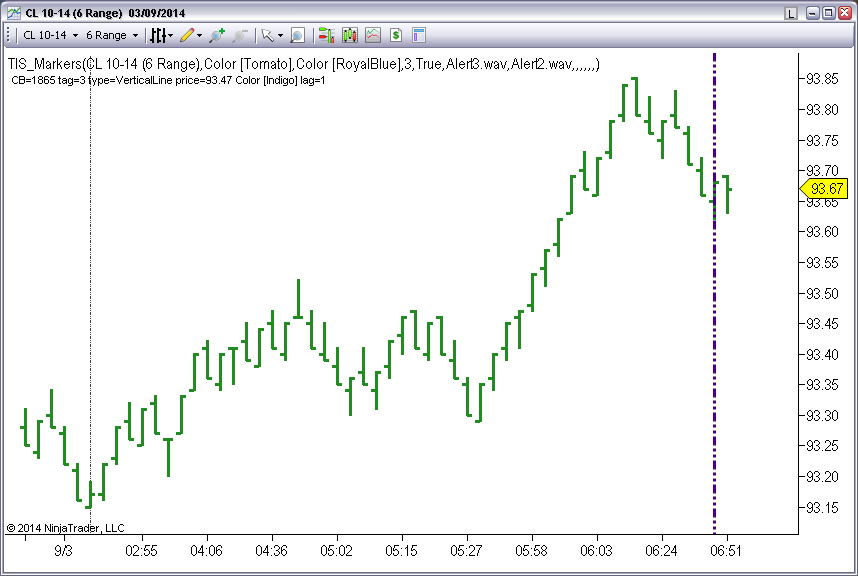
The Donchian Channel is also very useful, it has 3 lines : the upper, the lower and the median ( average between upper and lower ).

On this example I will use the Median of a 12 Bars Donchian:

These example Charts were generated with the TIS_Slope_Color Indicator for Ninjatrader, which allows to detect the Slope of any Indicator or combination of them as seen on this YouTube Video :


Hope you find these basic concepts useful to add or enhance your Trade Setups.

Please share and post any questions !

Best Regards,
Pablo Maglio

photo
Skype Skype id : pmaglio
      

Tuesday, March 31, 2015

Defining a Trade Setup using Crossovers with Ninjatrader

Hello Traders !

Today we are reviewing several Indicators that can be used to define a Crossover Trade Setup.

There are some Indicators that produce only one line, like EMA, SMA, HMA, etc.

Then we can use 2 Instances of same Indicator with different settings and check its Crossovers.

Examples : 

Crossovers of an EMA(14) vs EMA(7)

Note : The places where the Blue Line crosses above the Cyan Line there is a Long Entry Signal. Where the Blue Line crosses below the Cyan Line there is a Short Entry Signal.

On these type of Setups the Best Results can be obtained with faster Indicators like the HMA. 
The HMA produces faster and less lagged results as we can see on this Chart

Crossovers between an HMA(26) and an HMA(12) :

Note : On this example the Crossovers are indicated with Arrows using the Custom Indicator TIS_HMA_XO
The Entry Signals produced by the TIS_HMA_XO Indicator can be automated using the The Markers System.


Some other Indicators produce 2 lines like MACD, RSI, Stochastics, etc.
On those cases we can check the Crossovers of the 2 Lines produced by the Indicator.

Examples using 2 lines Indicators :

On this Chart we can see the Stochastic, MACD and RSI on the lower panes


Stochastic and RSI are Indicators that plot its lines in a defined range from 0 to 100, so we can define overbought and oversold zones.
MACD has no defined limit for its plots, so not suitable for overbought/oversold analysis but we can use it to trigger signals when the MACD crosses the AVERAGE lines as we can see on this Chart :

MACD Crossover ( MACD vs Average Line ) :


The Blue and Red Arrows indicate where the Macd crosses the Average Line.
These arrow signals can be painted by the Custom Indicator TIS_MACD_XO and automated using the The Markers System.

More info on this YouTube Video


RSI Crossover ( RSI vs Average Line )


As we can see the RSI produces a good amount of signals but it is very fast without lag. 
The values of RSI are limited between 0 and 100, so if we optimize its settings we can take only longs on the oversold area and only shorts on the overbought area. But the overbought/oversold level on RSI is not its best feature.
It should be used with some additional filter to select only Longs or Shorts depending on the trend. The trend can be defined by the last signal produced by some of the previously seen indicators, like the EMA's Crossover.
The Arrows signals shown on this chart are produced by the custom Indicator TIS_RSI_XO and can be automated using the The Markers System.


Stochastics Crossover ( K vs D Line )


The Stochastic has a very fast response and also a very precise determination of overbought and oversold levels so we can look at K vs D line Crossovers only on the OverBought and OverSold Areas.
On this example Chart, the  OverSold level is 10 and Overbought is 90, so a Blue Arrow ( Long Entry Signal ) is shown when K lines crosses above the D line and its was coming from below 10.
Red Arrows ( Short Entry Signals ) are shown when K line crosses below the D line and it comes from above 90.
These signals are produced by the TIS_STO_XO Custom Indicator. And the Entries can be automated using the The Markers System.

More info about this trade Setup on YouTube :


Hope you find these Trade Setup ideas useful for your use.
These are just simple pieces that we can use to create a more complex Setup.
As example, we can use any of the explained logic rules to define the trend, other to trigger an entry and then a different rule to trigger an exit.

Please post any questions, sugestions or ideas you wish to share...

Thanks and please share this post !

Pablo Maglio
photo
Skype Skype id : pmaglio
      

Sunday, December 14, 2014

SRS Setup

SRS Setup Review

Hello Traders !

Today we are revisiting the SRS, explaining its rules and different Trade Setups that we can trade with it.

  • Classic Use with the Trend
  • Classic Use against the Trend
  • Alternate use on SRSx Setup

Lets start for the Begining : Trend Definition

On SRS we use an exponential envelope (DarkGolden lines) and an exponential moving average (Blue Line) to define the trend.
The Blue Line has a slower ( higher ) period than the Envelope, usually a number in the order of 50, 100 or 200.
The Envelope uses a faster ( lower ) period to follow the price.
Its size is fixed, and it should be big enough to keep the Blue Line inside while the Market is in sideways mode or changing the trend.
We can control the size of the sideways zone by changing the size of the envelope.

The trend has 3 possible states :

  • Trending Down ( Envelope is all below the Blue Line )
  • Trending Up ( Envelope is all above the Blue Line )
  • No Trend = Sideways ( Blue Line is inside the Envelope )


Once the trend is defined, then we use a Donchian Channel to define the Trade Ready Condition :


When the Bars are touching the Upper Donchian and the Trend is Down, then we have a Short Trade Ready Condition.
Those bars are shown on the following picture with Orange Diamonds.

The Trade Setup Entry is at N ( default = 3 ) ticks below the low of the Signal Bar, just where the Diamonds are located.
That means that for Manual Trading this setup we place a Sell Stop Order over the Diamond and keep adjusting the Entry Price as each new Diamond is painted.
On the example shown above, we have an entry on the 3rd and final diamond ; the order placed there gets a fill at the next bar.

On the last version of the TIS_SRS Indicator we have the option to hide or show the lines ( EMA, Envelope and Channel ), the Diamonds, to paint the Bars according to the Trend and also the option to place a Marker where there is an entry, to make this indicator compatible with the Markers System.


Trade Setup against the Trend

On the classic ( with the trend ) setup the blue line is slower than the envelope ( blue line period > envelope period ).
On the counter trend Setup we exchange its values, so the blue line is now faster than the envelope  
Following the same rules with the Donchian and using the same Entry Technique than before we can see that we get long signals at the bottom extremes and sell signals at the tops.

Again, we can trade this Setup Manually by placing Entry Stop Orders over the Diamonds.
Or Enter the Market when we get an Arrow. This can be automated with the Markers System.

SRSx ( Extreme ) Setup

This Setup uses the same method to define the trend bu the Entry Technique is different.
On this Setup we trade a Breakout. And the breakout is detected when the Blue line gets outside of the Envelope.

As we can see on the above picture, the Blue line is faster than the Envelope.
When the Blue line is above the Envelope, then the Trend is Up and we get Blue Bars.
If Market is making new highs ( detected through the Bars touching the Donchian ) then we have a Diamond.
The Entry is at Market ; as soon as we get a Blue Diamond we Enter Long. Usually the first signals per side are the best, so we should only enter one or 2 times per side.
To automate this Setup we can use the Markers System by targeting the Diamonds as Entry Signals. The price location of the Diamonds has no use on this Setup.
The period of the blue line here should be very fast. And the size of the Envelope, should be tuned to avoid the system to trigger signals when not impulsing or trending. ( see left and right part of the Chart )

Parameters of TIS_SRS for SRSx Setup ;

To be able to follow the SRSx Setup with the TIS_SRS Indicator we need to do some tweaks on the parameters as shown :

As we can see, the colors are inverted, the period of the blue line is really fast with a period of 2. The offset to place the Diamonds is negative so we get them on the other side of the Bar. On this example, using a Range 6 Chart (where all bars are 6 ticks tall) placing the Diamond at -9 is like placing it at 3 ticks from the opposite extreme.

Related Videos :

I will post here links to related videos using the last version of the SRS Indicator and the Markers System to show how to configure and use them to trade the different Setups.

Live Examples using the 3 different trade setups and automating the Entries with Markers 
Pablo Maglio
www.TheIndicatorStore.com


Sunday, September 7, 2014

TIS_Markers Indicator for Ninjatrader

TIS_Markers Indicator for Ninjatrader

This indicator was designed to be placed on a Chart where other indicators are applied and showing useful Markers.
Most Indicators Show Trading Information via a Marker.

The most used Markers are :

Dots :

Diamonds :


Arrows :


Vertical Lines :


Other Markers :


Even More Available Objects :


All these Objects and Markers have several Variables that we can monitor ;


  • The Type of Object ; Dot, Diamond, Arrow Line, etc
  • The Color
  • The Tag ; each object on a chart has a unique name. We can double click on any object and review its properties on the "Data Tab"


  • On Text Objects we can also check at the Text Contents


With TIS_Markers we can Filter any Object placed by a Custom Indicator and generate a User defined Alert Sound.

These are the Input Parameters of TIS_Markers :


On this Example the Indicator is monitoring for an Arrow in any Color with the word "GoLong" in the tag. When it is detected, the audio file Alert2.wav is played.
It is also looking for any Red Text object displaying the word "Short" and with a Tag Name including the word "Sell"

There is an important parameter ; Lag_Max_Bars that determines how far the objects are drawn from current price action.
Example ; some indicator place their signal markers after several bars, so the markers looks great but on real time it is useless, so we can filter the signals drawn at a maximum number of bars from current price action.


PMS_Markers

This is the automation of the TIS_Markers Indicator and will allow to automate any Custom Indicator and convert it into a Strategy by Monitoring its Markers and placing ATM Orders in the Market.
Currently under development ( register for a pre-sale and get an important discount )
Estimated Release Date : Sept 24, 2014


Good Trading Everyone !

photo
Skype Skype id : pmaglio