Search This Blog

Showing posts sorted by relevance for query PM_EMA. Sort by date Show all posts

Friday, July 19, 2013

Ninjatrader Indicators - The Indicator Store - Trade Log 2013-07-19

Today is Options Expiration Day and also Crude Oil Contract Rollover, so it has been a tough trading day

These are System Trades for Today :

This was a short on Crude Oil ( on the New September Contract ) using the Ichimoku Setup.
The entry at signal required a long stop ( over the Kumo ) but it was also possible to get short at the Kumo retest

This was the first signal on the Ichimoku, but the setup was not complete because the Kumo was still in red, so supporting a short, not a long as the signal ; so... no trade

ATR Bar_Color Setup on Crude Oil ( on old contract )

SRS Setup on CL ( tough day today... only a good management on the last short would allow end on positive side )

SRS Setup on Gold ( wonderful day, 8 winners >15 ticks, one 15 ticks loser )

PM_EMA Setup on Dow Jones - 6 Range Chart ( 6 Winners )

You can get more info about these setup on this blog ; use the search tool to find SRS, PM_EMA or Ichimoku to find related posts...

Dont forget to review your subscription preferences at this link to change your options from daily, weekly or never receive the trade log

Regards,
Pablo

Friday, August 2, 2013

Ninjatrader Indicators - 2013-08-02- Trade Log

Trade Log for August, Friday 2nd

Crude Oil September Futures Contract ( CL 09-13 )
SRS Setup


High Volatility today, so lot of trades. Big and fast moves during the Unemployment Report and Crude Pit Session Open. Taking all the signals it was a low profit day, but taking only those signals with global support the Profit Potential was really big.

Ichimoku Setup


Gold - December Contract ( GC 12-13 )

SRS Setup - Several Longs in the Morning, with a double bottom and local retest at 1283. All winners
Fast moves near the "Unemployment Report", several short signals, most of them too fast to be traded.


Dow Jones September Contract - YM 09-13
SRS Setup with the trend ; 2 Short Losers + 1 Short Winner
SRS Countertrend Setup : 3 Long Winners+ 1 Long Loser
PM_EMA Setup : 2 Short Winners


Alternate PM_EMA Setup : 2 Winners + 1 Loser


Don't forget to check more info about the Indicators and Strategies at :
SRS Indicator - SRS Strategy - SRS Semiautomatic Strategy
ATR_BC Indicator - ATR_BC Strategy - ATR_BC Semiautomatic Strategy
Ichimoku Indicator
Volume Profile Indicator

Please subscribe or update your preferences on  this link 

Regards,
Pablo
logo Pablo Maglio The Indicator Store 

Tuesday, February 3, 2015

EMA Setup for Ninjatrader

We have discussed several times in the past the EMA Setup for Ninjatrader, as we can see on the links at the end of this article.

Today we are reviewing again the EMA, and its counterpart, the Bouncer.


The EMA Setup is one of the easiest to learn and trade ; it only uses an EMA ( Exponential Moving Average ) and a Fixed Envelope.

The EMA is included on all Platforms, including Ninjatrader.

The Fixed envelope are 2 lines located at a fixed distance from the EMA, one above and the other below.

Most of the Platforms include it. And on Ninjatrader we can get a free version here TIS_EMA_Envelope_Free

On the folowing examples the NEW custom indicator TIS_EMA_V6 will be used

On this example chart we can see an EMA Setup with Neutral Offset.
The EMA is not shown, only the Envelope around it (gray light lines).
When the price touches the Upper Envelope, the trend is Up and the bars are painted in blue.

The Entry Price is at EMA + Offset.

The Blue Points are the Entries, which are located over the EMA because offset is null.

The arrows show the moment where there is an Entry ( compatible with Markers System )

EMA con Offset Neutro

On the next Chart we can see an example with Positive Offset

The Entry Price, shown by the blue dots are over the EMA, at a distance in Ticks equal to Offset.
The type of Order to enter the Market on this Setup is Limit ;

As soon we get a blue dot, we must place a Buy Limit Order over the Blue Dot, and we must update the Entry Price Order each time a blue dot is placed at a different Price.

bl2

With the same logic, we can also use a negative offset, being the Entry Price then, below the EMA

bl3


As we commented at the start of the post, inverting the logic we have a new Setup that we have already commented in the past ; The Bouncer.

The new version 6 of the Indicator TIS_EMA_V6 has an input parameter to invert the logic as shown on the following picture :

bl4

Bouncer Examples :

Using a positive offset we can trade a return of the Market to the EMA after an enough deviation to touch the Envelope :

bl5


Using a negative or null offset on this Setup is useful to trades EMAs with bad response to bounces, producing breaks through the EMA most of the times.

bl6


As explained on previous posts, if we calculate the performance of trading bounces over an EMA and create a chart of the PnL against the period, we get a Performance Profile Chart (using always the same fixed target and stop)

Usually this profile is composed by a well defined series of peaks and lows.

If those peaks are positive, then those points represent the periods of the EMA to use on profitable EMA Setups

If the Lows are negative, then those points represent the periods of the EMA to use on the Bouncer Setup.


Some times, all the peaks and lows are on the positive side. On those cases there are no successful Bouncer Setups.

If all the peaks and lows are on the negative side, then there is no profitable EMA Setup.

Another point to take into account are the Commissions, because the number of trades depends on the period of the moving average to trade. If possible, we should include the commissions in the report before generating the chart.

More Related info on the Following Links :


Best Regards,
Pablo Maglio

photo
Skype Skype id : pmaglio
      

Thursday, November 15, 2012

Friday, August 17, 2012

PM_EMA

http://www.screencast.com/t/


wfOXiSI4cvAu
One of my best strategies that can be configured to be profitable in all kind of markets, from crude oil to bonds
This is the performance on crude oil trading just 1 contract with 15 ticks of target and stop


Wednesday, July 17, 2013

Trade Log 2013-07-17 using TIS Ninjatrader Indicators

Ichimoku Setup on CL - 3 trades ( 2 Longs and one short )

ATR_BarColor on CL - lot of trades, some losers near crude oil report, but positive day


SRS Setup on TF ( Russel 2000 ) - 3 Shorts today

SRS and EMA on YM ( Dow Jones )

SRS on Crude Oil ( CL )


You can get more info about these setup on this blog ; use the search tool to find SRS, PM_EMA or Ichimoku to find related posts...

Regards,
Pablo

Thursday, January 3, 2013

Trade Setup for Impulsive Markets


The most profitable markets are those with Impulsive Movements.
A Market leaves the Trend mode and switches to Impulse Mode when there are no more pullbacks big enough to get into the trade, and when it finally happens the move is finished leaving just a small winner or even a loser.
On volatile markets, the switch from sideways to Impulse is so fast that we dont even get an entry on the first trending pullback. This is why it is so important to define when the Impulse Mode is starting so we can use an early entry.
The most volatile markets are crude oil, gold, silver, nat gas ( CL, GC, SI, NG ).
Cash Index Markets like S&P ( ES ) are mostly on sideways or trending mode. Some of these trend moves may sometimes change to Impulse Mode, allowing to the trend entries increase their profits.
We have several ways combining classic Indicators, to define when the market is Impulsing.
The most used ways to trigger an Impulse Signal are :
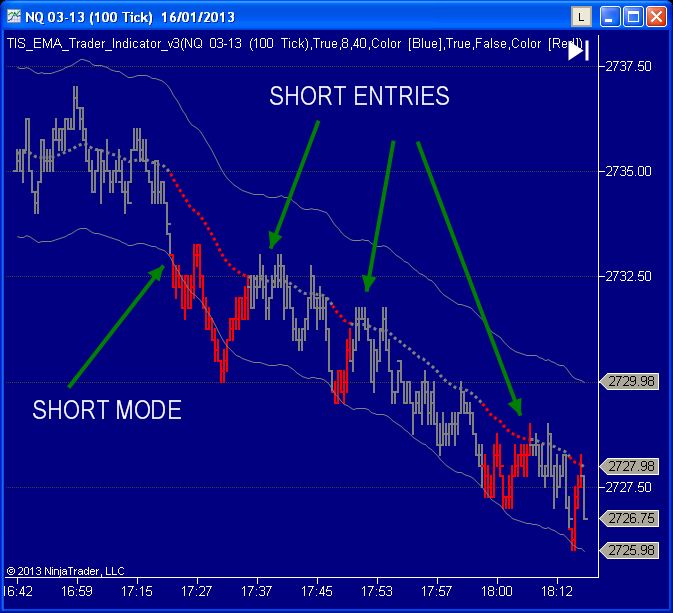
1)      A Fast Moving Average crossing outside a Slow Band
2)      A Fast Band crossing all outside a Slow Band ( similar to previous method but with an extra security margin)
In the following Charts we can see both Methods ; ( The vertical Red Line shows where the Impulse Mode Starts on each example )
comienzo_modo_impulso     comienzo_modo_impulso2
 The Band can be a Bollinger Band, a Keltner Channel or a Fixed Envelope ( like on the examples shown )
We have to take into account that if we use Range Charts, all Bars will have same height, so volatility ( and ATR ) will be constant, turning Keltner Channels into Fixed Envelopes.
Now we have different ways to define the Impulse Mode Signals, now we just need to define the entry.
In a trend system, we use the slow EMA ( like on the PM_EMA setup ), but on Impulsive Moves, the Markets never come back to the EMA.
The entry can be defined again using an envelope ( Bollinger, Keltner, Fixed ) of lower size than the signal envelope ;
An entry for example 1 can be the lower slow band ( green) 
An entry for example 2 can be a 50% of upper fast band ( blue )
As shown, using EMAs and Envelopes to define signals and entries, we can get a big number of different setups. We just need to find the best combination for each Instrument.
Having all these rules automated is a big Help that let us backtest, optimize and even trade any configuration. We at The Indicator Store have a Strategy Pack called PM_Impulse, that contains several individual strategies following different combinations of the explained setups.
If you like this article please leave your comments and share with your firneds
Regards,

Thursday, September 6, 2012

Trading a Moving Average

Is it possible to define a trade system only with a moving average (MA) ?
That would be something like this ;
If price is above the MA then we place a limit order at its price value...
If price is below, then we place a sell limit at the MA price value...
We could also define a zone where no trades should be placed...
...let say, while price is too close the MA, then we have no trend ; so no trades.
If price goes far enough from the MA, then we have a defined trend, so we start chasing the MA.
Sounds easy...but ;
Can we find a combination of timeframe and period of MA that produces results ?

I created a long time ago a strategy that exploits that edge, it is called PM_EMA and its first purpose was just that ; find good moving averages to work with...

Using the Strategy Analyzer Tool on Ninjatrader we can run an optimization process where we test the strategy using a range of moving averages, and then create a chart where we can get the PnL vs period ( see attached picture )


The horizontal axis represents the period of an exponential moving average, the histogram is the Profit/Loss of trading it with fixed target and stop. The red line is the number of trades ( its value is on the right vertical axis ).
So we must find the best spots where the profit is maximized and the number of trades is low enough to cover the comisions...

I started this thread to all those followers as me to discuss the best settings we find about this setup.
Regards,
Pablo

Wednesday, July 24, 2013

Ninjatrader Indicators - The Indicator Store - Trade Log 2013-07-24

SRS Setup on Crude Oil ; All Longs, 4 Winners and 1 Loser

SRS on EUR-USD Future ; 4 Shorts all Winners

SRS Setup on Gold ; all Longs, 3 Big Winners, 3 small winners or BE and 2 losers

No trades on Ichimoku Setup ; only one short ( winner ) but too late during lunch

Dont forget to use the search tool on the blog to find information about each setup (PM_EMA, ATR_BarColor, SRS, Small Range, Ichimoku, etc )

Please subscribe or update your preferences on  this link 

Regards,
Pablo
logo Pablo Maglio The Indicator Store 
Facebook Twitter LinkedIn Blogger Elance

Saturday, January 19, 2013

PM_EMA Strategy for NinjaTrader - Setup Review

Hello everyone !
It has been a long time since the last post we made about this setup, so we are going to explain it to the maximum detail and show how to trade it with its TIS_EMA_Indicator and the Strategy PM_EMA_Trader.


This is a Trend Following Setup, so it works better with trending Markets.
It can be optimized for Impulsive Markets, but it will not perform in its best way. There are other Setups focused to Impulsive Markets ( See Impulse Setup ).

In terms of simplicity and easy to use this is one of the most easy and simple setups to follow and we only need to focus on 2 ( two ) Indicators :

  • An Exponential Moving Average ( EMA )
  • An Envelope ( Fixed number of ticks above and below the EMA )

The Exponential Moving Average (EMA) defines the trend and also is the entry ;
...when price is above the EMA, we want to go Long at its price
...when price is below the EMA, we want to go Short at its price

The logic is that the price will bounce near the moving average, several times, until the trend is over.... ( more about this later...)

Now we need to define when we are trade ready, and this is where we use the envelope.
While price is inside the envelope, we can consider the market is in sideways mode. So, no signals, no trades...

When price touches the upper band of the envelope, the setup changes to BUY Mode.
When price touches the lower band of the envelope, the setup changes to SELL Mode.

Some examples on the following charts :


This example starts with bars inside the envelope, so the setup is in neutral mode.
When bar touches upper band, the Buy Mode Start and we start looking for an entry at the moving average


Similar example for Short Signal :

On this example price start from inside the envelope ( bars are gray ) until the low of one bar touches the lower envelope and the Setup switches to Sell Mode.
At this point we start looking to short the moving average.
We get several entries ; each time price touches the lower band the bars turn red and the setup sets to Sell mode again.


What happens when the trend is over ...?

Lets look at the following example ;

We can see on the last Short of this chart, that price continued going against the trade touching the upside band triggering the Buy Mode.
If our stop is big enough to survive this move, when the price comes back to allow the long entry we can unload the short entry at a minimal loss.
This behavior is very frequent on  trending markets.


There are several ways to trade this setup, we can use a small stop, slightly lower than the envelope size, so we have a standard size loser at the end of the trend. The advantage is that those losers will be always equal and small.
Or we can use a big stop, usually twice the size of the envelope, resulting in a final average loser small but with some big losers.

Detail of the reversal procedure :


On these example charts we are using the Indicator for Ninjatrader TIS_EMA_Trader_Indicator with which we can indicate the period of the moving average and the size of the envelope and it will paint bars according to the trade setup.

With this trade setup automated, like the PM_EMA_Trader Strategy, we can 


  • Perform a Scan of all moving averages to find the bests to use and worsts to avoid


  • Optimize Targets, Stops and Envelope Sizes
  • Research Best Times and Days of Week to trade
  • AutoTrade the Setup !
If you have any question about this setup just let me know or post your opinions here !

Regards,

logo    Pablo Maglio The Indicator Store 
 Pablo@TheIndicatorStore
 www.TheIndicatorStore.com 
Facebook Twitter LinkedIn Blogger Elance