Search This Blog

Showing posts sorted by date for query impulse. Sort by relevance Show all posts

Thursday, November 12, 2015

Markers Plus 4 for Ninjatrader - Creating our own Trade Setup

Markers Plus 4 for Ninjatrader
Creating our own Trade Setup

Hello Traders

As we know, a trade setup consists on set of rules that define when to Enter the Market and in which Side, Long or Short. 
It can be just that, or can include also a rule set to define when to close a position.

As we saw on previous posts, Markers Plus 4 include tools to create Signals.
Those Signals can be used to either enter the Market or Exit the Market.

Lets review the most important included tools :


  1. Universal Slope Tool
  2. Universal Crossover Tool

Universal Crossover Tool

With this Tool we can identify the Cross between any pair of lines. Those lines can be drawn by any indicator installed on the platform.

Example :

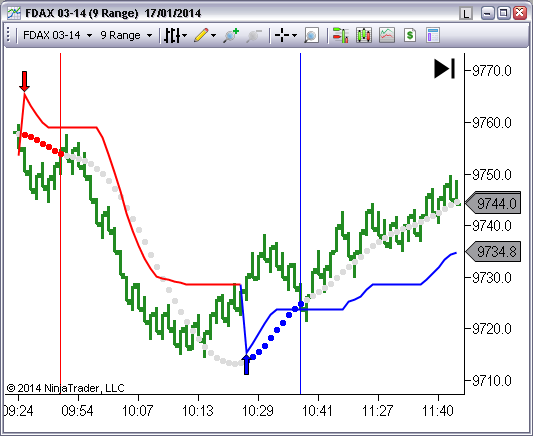
These pair of Red and Blue Lines are an example of 2 things ;

  1. We can define the trend by the relative position
    When Red Line is above Blue Line, the trend is Up
    So, we only take Longs
  2. We can also paint a signal on the crosses ;
    When Red cross above the Blue, we have a Buy Signal
    ( or an Exit Short Signal )
Both items can be done with the Crossover Tool

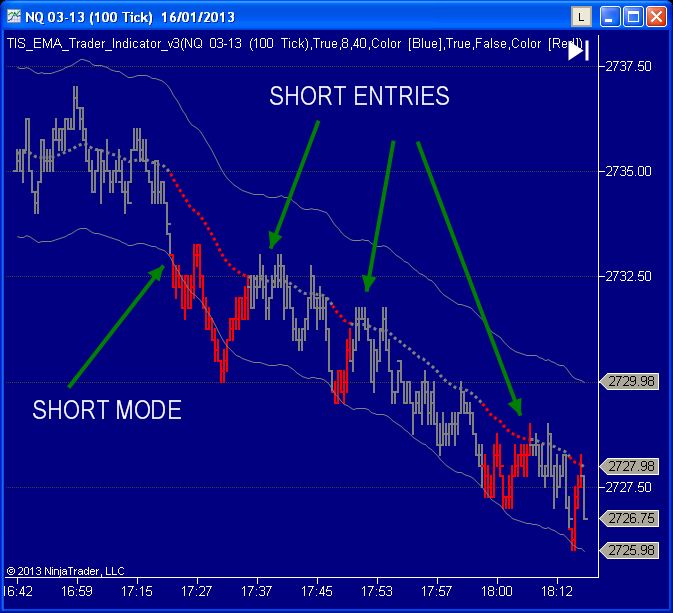
Example applying the Crossover Indicator :

We get Up and Down Arrows painted in user defined Colors, so they can be used by Markers to initiate or exit a Position.
We also get a histogram with the difference between both lines, positive when red line is above the blue. Negative when below.
We can use this difference as a filter condition on Markers.
Example ; Taking only longs when histogram >0 ( or a threshold )
Take only shorts when histogram < 0 ( or a threshold )


This tool is really powerful to research and backtest new setups as we can see the results in real time on the historical data ( as seen on the chart )
We can change the settings of the indicator or the indicators itself that generate those lines and have the result at the instant.
Remember that those lines can be any plot of any indicator on your platform.
No need to Market Replay.
No need to create a Strategy.
Just create your logic, watch it on your chart, and put it to auto trade with Markers.

Some examples : 

  • Fast EMA vs Slow EMA ( this is a classic )
  • EMA crossing above an upper Donchian ( long signal )
    ...crossing below the Lower Donchian ( short signal )
  • SMA crossing above a Bollinger Upper Line ( long impulse signal )


Universal Slope Tool

With this Tool we can calculate the Slope of any line painted by any Indicator installed on our platform.
The slope is calculated by the difference of the indicator's line current value and N bars ago

This indicator draws a histogram with the slope and also paint signals when there is a slope directional change :


As we can see, with these 2 Tools, almost all possible Trade Setups can be recreated and Executed on Full Automatic, Semiautomatic or Manual Mode with Markers.


Feel free to ask for a demonstration if you want to see it working.


Best Regards,
Pablo Maglio


photo
Skype Skype id : pmaglio
      

Saturday, February 1, 2014

Automated Strategies for Ninjatrader

Hello Traders !

On this article we are going to review all our trade setups that have a Strategy for Ninjatrader fully automated and can be back tested, optimized and traded live.

This is a list of all those ordered in function of its low complexity ;
  1. EMA ( it trades an Exponential Moving Average ; Read More )
  2. Bouncer ( it is an anti EMA ; as it trades against it )
  3. Vwap ( it trades the Volume Weighted Average Price )
  4. SRS ( Custom Setup ; Read More )
  5. ATR_BarColor
  6. Impulse
  7. High Low Crossover

On this setup we only need to optimize a pair of parameters ;
  • The period of a Moving Average
  • The size of an envelope
The size of the envelope is slightly lower than the stop we are planning to use, so we can focus on finding the Period

This is an example using the Optimizer to scan Moving Averages on ES, looking for a 1.5 points of target against 2 points of Stop :


Depending on the level of the commisions, then we have a few areas with good moving averages to trade with.

This is an example of the equity curve using an EMA(166) :


Now we can optimize all other settings trying to obtain a better shaped equity curve ;


This systems trades agains the PM_EMA, so we can use the same PnL vs Period Chart, and trade the worst performing moving averages. It works better on non trending, but more volatile markets like Crude Oil or Gold

3) PM_VWAP
Similar logic used by PM_EMA, but replacing the moving average by the vwap.
Something interesting about the vwap is that it produces the same result on any timeframe, so this setup is almost not related to time frame. The only impact changing the time frame is the possibility of taking more trades over same entry.

This is a system that uses an envelope, a moving average and a donchian channel to define the trend and entry logic.
It can be configured with or against the trend. (Read More)

This is an optimized report example on CL using a Range 9 Bar Chart taking into account last 2 months ( Dec 2013 and January 2014 )


5)PM_ATR_BarColor

UNDER CONSTRUCTION

Best Regards,
Pablo

logo 
Pablo Maglio The Indicator Store 

Facebook Twitter LinkedIn Blogger Elance  G+  YouTube

Saturday, January 18, 2014

Supertrend Setup for Ninjatrader

Hello everyone !

Most of you may already know the Supertrend Indicator, it has been available for most platforms including Ninjatrader.
There are several versions, some of them free and including different calculation modes.
It is basically a trend detection systems very useful also for trailing stop management purposes.
On the following chart we can see the trend changes indicated by arrows when the line is calculated with the default settings ; an HMA(14) and a multiplier of 2.618

and on the following chart, the HMA is changed by the Median ;

Using an SMA :

Same SMA, but changing the multiplier from 2.618 to 1

As we can see, this is a very flexible and powerful indicator to define trend and reversals.
If we are in the Market, the indicator can be used to keep the trailing stop slightly below its line.
If we are looking for an Entry, once a trend change is detected ( red and blue arrows are painted ) we have several options :
  • Enter at Market
  • Wait for a pullback with a Limit Order Entry
If we decide to use the pullback entry option, then we need to define How to Calculate the Entry.

A suggested approach is using same line study used for the supertrend but with a slower period.
Lets review the SMA example where the supertrend is calculated with an SMA(8) and a multiplier of 2.618.
Now we add an SMA(17) ( dotted line ) and we have a complete trade setup :
Once we have a trend change ( arrow ) we place a limit order at the SMA.
On the following chart we can see a short at red dotted line and then a long at blue dotted line.
Entry time bars are marked with vertical lines :

Another example with HMA : supertrend with HMA(10) and Entry with HMA(50)

How to Manage the Trade

It is evident that this system will get the best results on impulsive and trending markets when we use runners.
When holding a position and using a trailing stop, at some time the trend will lose impulse and there will be a reversal.
For example, on the following Chart we can see a long filled after 4 or 5 bars of the arrow up :
If our trailing stop is big enough to survive all the way up and then we get a red arrow down we have several options ;
  • Close the long after a red down arrow is painted
  • Leave the position alone being managed by its trailing stop
  • Reverse the Long Position at New Short Entry ( red dots ) assuming the long trailing stop is not triggered.
On The Indicator Store we have a Custom TIS_Supertrend Indicator with all the User defined settings to define the Trend and also a user defined Entry as shown on previous Chart.

If you like the Supertrend possible Setups using the rules explained, it can be automated by Markers ; a Semi Automatic and also Full Automatic System that trades all possible trade setups described. 
It has the option of Early Exit; in case we are holding a position, and an inverse arrow ( trend change ) is painted we can decide if closing actual position or not.
If we decide not using early exit, then the current position will be exited at trailing stop or reversed at new entry.

Let me know if you have any question or suggestion...
Best Regards,
Pablo

Monday, July 15, 2013

Trade Log 2013-07-15 using TIS Ninjatrader Indicators

This is the Trade List using TIS Setups :

ATR_BarColor on Crude Oil ( CL )
Foto: ATR_BarColor on Crude Oil ( CL
Read More : http://t.co/MALIUAgW4j
Obtenga mas Información : http://theindicatormarket.com/blog/estrategia-atr_barcolopara-ninjatrader/

SRS Setup on YM
Foto: SRS Setup on YM
Read More about SRS on : http://t.co/Z78PZQc4Yk
Obtenga mas información acerca del SRS en : http://theindicatormarket.com/blog/indicador-small-range/

SRS Setup is Long on CL from the Lows

Foto: SRS Setup is Long on CL from the Lows
El SRS tuvo 3 Entradas de Compra Hoy, todas favorables, la última fue el minimo del día ( 104.75 ) . El crudo llego a 106.00, mas de 1 punto ( $1000 por contrato) en menos de 1 hora...

SRS Long Signals on GOLD

Foto: SRS Long Signals on GOLD today
VArias señales del Setup SRS en el ORO, todas con al menos 10 ticks de Target 1, y una de las mismas con mas de 10 puntos ( $1000 por contrato ) de ganancia. El riesgo por trade es de $150 por contrato

First Impulse Signal on British Pound ( GBPUSD / 6B )
Foto: First Impulse Signal on British Pound ( GBPUSD / 6B )
Risking 10 ticks ( usd 6,25 on futures ). More than 20 ticks available
Read More on http://t.co/86CMoiiYP3
Primera señal de Impulso en la Libra ( GBPUSD / 6B ) arriesgando 10 ticks (  $6,25 en futuros ) y mas de 20 ticks disponibles de objetivo.
Obtenga mas informacion en : http://theindicatormarket.com/blog/estrategia-de-impulso-en-forex/

Ichimoku followers ? Here is a CL with the Cloud ( Kumo ) as Support
Foto: Ichimoku followers ? Here is a CL with the Cloud (  Kumo ) as Support
Read More info : http://theindicatorstore.blogspot.com.ar/2013/07/ichimoku-indicator-setup-for-ninjatrader.html

Para los seguidores del Ichimoku, aqui hay un largo del Crudo con la Nube de soporte.
Mas informacion : http://theindicatormarket.com/blog/ichimoku-para-ninjatrader/

Wednesday, January 30, 2013

Impulse Trades of the Week

These are the Last Trades of the Impulse Setup, as we explained the last week

British Pound Futures ( 6B ) and Forex ( GBPUSD)


The chart has overlapped the entry markers of the Indicator TIS_Impulse_Indicator and the entries executed by the PM_Impulse Strategy.

As we see there is only 1 entry missed due the time filter used on the strategy.

Euro Futures ( 6E ) and Forex ( EURUSD)


This chart shows the same setup executed on Euro Futures ( or EUR-USD Currency Pair on Forex ).
We are missing one trade again, because the start time adjustment of the strategy.

As we already explained, the Impulse Setup Logic is SIMPLE;

When a Fast Band is above a Small Band, We are in Long mode.
When a Fast Band is below Small Band, We are in Short mode.

..on old versions ( PM_Impulse_v2), Fast Band was just a moving average. This behavior can be emulated on this last version using a null width.

Once We are in Long/Short Mode, the system Entry on all prior versions was related to the Slow Band.
On this new release, we can take more aggressive entries by referring the Entry to a different Band. I suggest using the Fast, but any Period can be selected.
On the following example, we are using the same Impulse Setup on Euro but changing the Entry to the Fast Band :


We are proud to announce that the new version of the Impulse Strategy ; PM_Impulse_V6 is ready and will be delivered to all current owners of PM_Impulse.
It can trade all setups covered by prior versions and all combinations available on the TIS_Impulse Indicator, so the combinations of different setups is huge.
Impulse V6 has the Donchian Channel Filter introduced on V5, Trend Filter, AutoBreakeven , and Trailing Stop using the TIS_Multitrail Indicator.


Input Parameters of PM_Impulse_V6


Please post any questions or suggestions or send me an email.
Regards,
logo Pablo Maglio The Indicator Store 
Facebook Twitter LinkedIn Blogger Elance

Saturday, January 19, 2013

PM_EMA Strategy for NinjaTrader - Setup Review

Hello everyone !
It has been a long time since the last post we made about this setup, so we are going to explain it to the maximum detail and show how to trade it with its TIS_EMA_Indicator and the Strategy PM_EMA_Trader.


This is a Trend Following Setup, so it works better with trending Markets.
It can be optimized for Impulsive Markets, but it will not perform in its best way. There are other Setups focused to Impulsive Markets ( See Impulse Setup ).

In terms of simplicity and easy to use this is one of the most easy and simple setups to follow and we only need to focus on 2 ( two ) Indicators :

  • An Exponential Moving Average ( EMA )
  • An Envelope ( Fixed number of ticks above and below the EMA )

The Exponential Moving Average (EMA) defines the trend and also is the entry ;
...when price is above the EMA, we want to go Long at its price
...when price is below the EMA, we want to go Short at its price

The logic is that the price will bounce near the moving average, several times, until the trend is over.... ( more about this later...)

Now we need to define when we are trade ready, and this is where we use the envelope.
While price is inside the envelope, we can consider the market is in sideways mode. So, no signals, no trades...

When price touches the upper band of the envelope, the setup changes to BUY Mode.
When price touches the lower band of the envelope, the setup changes to SELL Mode.

Some examples on the following charts :


This example starts with bars inside the envelope, so the setup is in neutral mode.
When bar touches upper band, the Buy Mode Start and we start looking for an entry at the moving average


Similar example for Short Signal :

On this example price start from inside the envelope ( bars are gray ) until the low of one bar touches the lower envelope and the Setup switches to Sell Mode.
At this point we start looking to short the moving average.
We get several entries ; each time price touches the lower band the bars turn red and the setup sets to Sell mode again.


What happens when the trend is over ...?

Lets look at the following example ;

We can see on the last Short of this chart, that price continued going against the trade touching the upside band triggering the Buy Mode.
If our stop is big enough to survive this move, when the price comes back to allow the long entry we can unload the short entry at a minimal loss.
This behavior is very frequent on  trending markets.


There are several ways to trade this setup, we can use a small stop, slightly lower than the envelope size, so we have a standard size loser at the end of the trend. The advantage is that those losers will be always equal and small.
Or we can use a big stop, usually twice the size of the envelope, resulting in a final average loser small but with some big losers.

Detail of the reversal procedure :


On these example charts we are using the Indicator for Ninjatrader TIS_EMA_Trader_Indicator with which we can indicate the period of the moving average and the size of the envelope and it will paint bars according to the trade setup.

With this trade setup automated, like the PM_EMA_Trader Strategy, we can 


  • Perform a Scan of all moving averages to find the bests to use and worsts to avoid


  • Optimize Targets, Stops and Envelope Sizes
  • Research Best Times and Days of Week to trade
  • AutoTrade the Setup !
If you have any question about this setup just let me know or post your opinions here !

Regards,

logo    Pablo Maglio The Indicator Store 
 Pablo@TheIndicatorStore
 www.TheIndicatorStore.com 
Facebook Twitter LinkedIn Blogger Elance