Search This Blog

Saturday, January 19, 2013

PM_EMA Strategy for NinjaTrader - Setup Review

Hello everyone !
It has been a long time since the last post we made about this setup, so we are going to explain it to the maximum detail and show how to trade it with its TIS_EMA_Indicator and the Strategy PM_EMA_Trader.


This is a Trend Following Setup, so it works better with trending Markets.
It can be optimized for Impulsive Markets, but it will not perform in its best way. There are other Setups focused to Impulsive Markets ( See Impulse Setup ).

In terms of simplicity and easy to use this is one of the most easy and simple setups to follow and we only need to focus on 2 ( two ) Indicators :

  • An Exponential Moving Average ( EMA )
  • An Envelope ( Fixed number of ticks above and below the EMA )

The Exponential Moving Average (EMA) defines the trend and also is the entry ;
...when price is above the EMA, we want to go Long at its price
...when price is below the EMA, we want to go Short at its price

The logic is that the price will bounce near the moving average, several times, until the trend is over.... ( more about this later...)

Now we need to define when we are trade ready, and this is where we use the envelope.
While price is inside the envelope, we can consider the market is in sideways mode. So, no signals, no trades...

When price touches the upper band of the envelope, the setup changes to BUY Mode.
When price touches the lower band of the envelope, the setup changes to SELL Mode.

Some examples on the following charts :


This example starts with bars inside the envelope, so the setup is in neutral mode.
When bar touches upper band, the Buy Mode Start and we start looking for an entry at the moving average


Similar example for Short Signal :

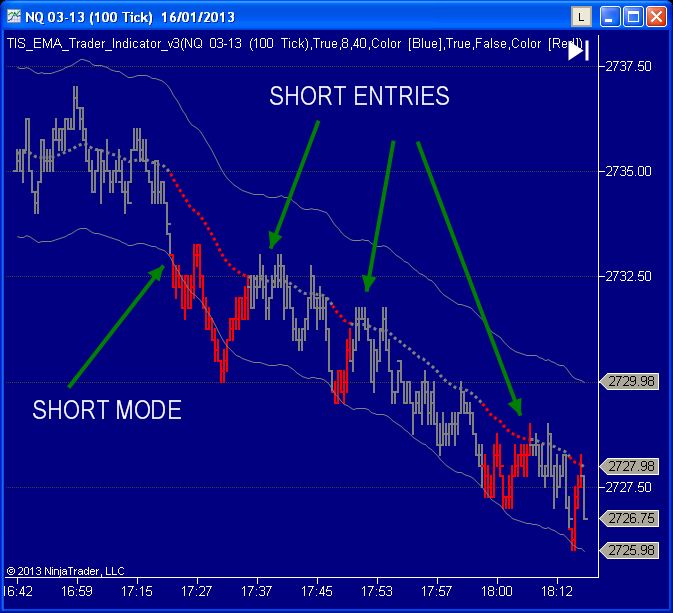
On this example price start from inside the envelope ( bars are gray ) until the low of one bar touches the lower envelope and the Setup switches to Sell Mode.
At this point we start looking to short the moving average.
We get several entries ; each time price touches the lower band the bars turn red and the setup sets to Sell mode again.


What happens when the trend is over ...?

Lets look at the following example ;

We can see on the last Short of this chart, that price continued going against the trade touching the upside band triggering the Buy Mode.
If our stop is big enough to survive this move, when the price comes back to allow the long entry we can unload the short entry at a minimal loss.
This behavior is very frequent on  trending markets.


There are several ways to trade this setup, we can use a small stop, slightly lower than the envelope size, so we have a standard size loser at the end of the trend. The advantage is that those losers will be always equal and small.
Or we can use a big stop, usually twice the size of the envelope, resulting in a final average loser small but with some big losers.

Detail of the reversal procedure :


On these example charts we are using the Indicator for Ninjatrader TIS_EMA_Trader_Indicator with which we can indicate the period of the moving average and the size of the envelope and it will paint bars according to the trade setup.

With this trade setup automated, like the PM_EMA_Trader Strategy, we can 


  • Perform a Scan of all moving averages to find the bests to use and worsts to avoid


  • Optimize Targets, Stops and Envelope Sizes
  • Research Best Times and Days of Week to trade
  • AutoTrade the Setup !
If you have any question about this setup just let me know or post your opinions here !

Regards,

logo    Pablo Maglio The Indicator Store 
 Pablo@TheIndicatorStore
 www.TheIndicatorStore.com 
Facebook Twitter LinkedIn Blogger Elance

Friday, January 18, 2013

Week Trades using Indicators for Ninjatrader from The Indicator Store

Hello ! We will describe the trades we could execute this past week using the Indicators for Ninjatrader designed by The Indicator Store ; TIS_Small_Range and TIS_Impulse_Trader.


Impulse Strategy

On the following charts, we can see the entries of the Impulse Setup on the British Pound  ( Forex : GBPUSD ) and a comparison of its entries to the futures version ( 6B )
Impulse Setup on GBPUSD R6
As we can see on the next chart, this system is valid on Forex and futures, showing the same entries on both
The only difference is the tick value ( $6.25 ) vs GBPUSD pip value.
Impulse Setup on 6B R6
The British Pound (6B)(GBPUSD) has been moving very well this week, making this strategy very profitable.
The Timeframe used is Range 6 and the parameters are :
Slow Moving Average Period =
Channel Size = 8 ticks/pips
Fast Moving Average = 8
Entry = -3 ticks/pips from Slow moving Average
On the following Chart, we see the same Strategy applied to the euro-dolar pair (EURUSD).
As we already explained, this is also valid for Euro Future ( 6E ).
Impulse Setup on EURUSD R6
 On this example, we had 3 sell signals today ; 1st got the initial target, 2nd was a loser and last short got 1st and 2nd target ( or exited at trailing stop )
For the Euro Setup We replace the fixed envelope by a Bollinger ;
Bollinger Period = 50 , Standard Dev = 0.5
Fast Moving Average = 8
Channel Size = 5 ticks ( around Fast Moving average)
Entry = Slow Bollinger Band with Standard Deviation = 0.8

Small Range Setup

This chart shows the Small Range Setup applied to Gold using a 9 Range Timeframe.
Small Range Setup on GC 9R
Today , Gold was mostly on sideways mode, without allowing to get bigger targets than usual.
We had a long with a target 1 winner and runner out at breakeven. Then a short winner, again, with runners out at breakeven, and finally a short loser.
Have a Great Long Weekeend !

Share and Enjoy

  • Facebook
  • Twitter
  • Delicious
  • LinkedIn
  • StumbleUpon
  • Add to favorites
  • Email
  • RSS

Monday, January 14, 2013

Small Range and Impulse Indicator Alignment


On the following chart, we can see the use of the Impulse Indicator and Small Range Indicator for NinjaTrader showing the first short signal of the week on Crude Oil.

Luckily, both signals of both uncorrelated systems are triggering on same Price Area
The implied risk of both trades are similar and in the range of usd 150, while the possible target is bigger than usd 500 using trailing stop.
CL_SmallRange_Short_Jan_14
First Sell Trade of the Week using Small Range Setup
CL_Impulse_Short_Jan_14
First Sell Trade of the Week using the Impulse Strategy
As you can guess, nothing better for a strategy, to have another uncorrelated setup aligned on same Price Area
For those who follow these Setups, knowing the fact of confluence increases the probability of success.
Regards,

Monday, January 7, 2013

Impulse Setup on EURUSD and AAPL


Hello, Welcome !
On this new Article we continue analyzing the Impulse Setup. Now the question is ; Is this useful for Forex or Stocks ? .... YES ! !
On this publication I will share with you examples of application of the Impulse Setup On Forex and also on Stocks ( AAPL ).

The following chart is a 15 Minutes EURUSD with the Impulse Setup Indicator applied.

We can see several shorts happened last week, and today we had the first long ( currently a nice winner )

Estrategia de Impulso en Forex, par EURUSD, 15 Minutos


And now an example on Stocks, for example a 15 minute AAPL chart :

Estrategia de Impulso en AAPL

The number of trades is much lower on stocks than Forex, and the number of signals on Forex is even much lower than Futures. But the system works anywhere.
Please remember that on previous posts I have much more detailed information about this Setup.
The Indicator Store has dedicated Indicators and Strategies for this setup, to visualize, identify, backtest and optimize its settings. 

If you liked this article please share and post any comments.

Regards,

Friday, January 4, 2013

Impulse Setup on Gold


As a continuation of yesterday's Post where We explained the Impulse Setup, today We had an excellent example of this Setup on Gold ( GC )
In the attached chart we can see how after the Employment Report at 8:30 ET, the Gold Market had some quick moves almost impossible to trade ( take a look at the  TIS_Bar_Time indicator at the bottom of the Chart showing several bars with time duration close to zero ).
After Maket calmed from the Report reaction, the Bar duration returned to an average of 30 seconds and We had 2 signals ; 
A Short, with only target 1 available ( 10 to 15 ticks ). Rest of position out at break even.
A Long, with first and second targets, and also a possible runner with trailing stop
Impulse_ex_Gold_Jan_4
 If you liked this setup or have any questions and suggestions please post and share !
 Regards,

Thursday, January 3, 2013

Trade Setup for Impulsive Markets


The most profitable markets are those with Impulsive Movements.
A Market leaves the Trend mode and switches to Impulse Mode when there are no more pullbacks big enough to get into the trade, and when it finally happens the move is finished leaving just a small winner or even a loser.
On volatile markets, the switch from sideways to Impulse is so fast that we dont even get an entry on the first trending pullback. This is why it is so important to define when the Impulse Mode is starting so we can use an early entry.
The most volatile markets are crude oil, gold, silver, nat gas ( CL, GC, SI, NG ).
Cash Index Markets like S&P ( ES ) are mostly on sideways or trending mode. Some of these trend moves may sometimes change to Impulse Mode, allowing to the trend entries increase their profits.
We have several ways combining classic Indicators, to define when the market is Impulsing.
The most used ways to trigger an Impulse Signal are :
1)      A Fast Moving Average crossing outside a Slow Band
2)      A Fast Band crossing all outside a Slow Band ( similar to previous method but with an extra security margin)
In the following Charts we can see both Methods ; ( The vertical Red Line shows where the Impulse Mode Starts on each example )
comienzo_modo_impulso     comienzo_modo_impulso2
 The Band can be a Bollinger Band, a Keltner Channel or a Fixed Envelope ( like on the examples shown )
We have to take into account that if we use Range Charts, all Bars will have same height, so volatility ( and ATR ) will be constant, turning Keltner Channels into Fixed Envelopes.
Now we have different ways to define the Impulse Mode Signals, now we just need to define the entry.
In a trend system, we use the slow EMA ( like on the PM_EMA setup ), but on Impulsive Moves, the Markets never come back to the EMA.
The entry can be defined again using an envelope ( Bollinger, Keltner, Fixed ) of lower size than the signal envelope ;
An entry for example 1 can be the lower slow band ( green) 
An entry for example 2 can be a 50% of upper fast band ( blue )
As shown, using EMAs and Envelopes to define signals and entries, we can get a big number of different setups. We just need to find the best combination for each Instrument.
Having all these rules automated is a big Help that let us backtest, optimize and even trade any configuration. We at The Indicator Store have a Strategy Pack called PM_Impulse, that contains several individual strategies following different combinations of the explained setups.
If you like this article please leave your comments and share with your firneds
Regards,

Tuesday, January 1, 2013

OpenGap Indicator for NinjaTrader

There is a lot of info about the Gaps, and mainly about those not yet closed ; the OpenGaps. In the following article I will show the several ways we can use the OpenGap Indicator.

To begin, we must define what is a "Gap" ; it is the difference between prior session Close and current session Open.
This definition limits the number of markets where this definiton is valid to apply ; We need an instrument with  a well defined Day Session time like Standard and Poors ( ES ), where there is a  24 Hours Market, but the main Volume is in the Day Session Trading Time.

If the Gap ( Yesterday's Close - Today's Open ) is greater than a certain value ( usually 2 to 3 points in ES ) then we consider there is an Open Gap.

The Open Gaps are followed by lot of Traders, so its importance as Support and Resistance is huge. If We are not following this Strategy, We should at least have into account the existent Open Gaps, to act according to their location. For example, taking a partial or total profit slightly before the next Open Gap is a good idea to start.

In the following picture, we can see a recent example from December 28, 2012:

TIS_Open_Gaps_4

Another examples form November 2012
TIS_Open_Gaps_5
These example pictures are using the Indicator OpenGap for NinjaTrader, that can be obtained on the following link
If you liked this article, please comment or share with your friends.
Regards,

Thursday, December 27, 2012

TIS Squeeze Darvas Setup Indicator

On this New Post I will explain the Squeeze Darvas Setup and how to trade it with an Indicator for Ninjatrader

The Name of the Setup is Darvas_Squeeze and the indicators needed are :

  • Squeeze Indicator
  • Darvas Indicator
For the purpose of this explanation I will be using TIS_Squeeze and TIS_Darvas but any general Squeeze and Darvas indicators will work fine.

If you are not sure how a Squeeze indicator works, it is very easy to understand, in fact, if you don't have a squeeze indicator, with just a Keltner and a Bollinger is possible to know when there is a squeeze signal condition :


On the following picture we can see a blue envelope ( Keltner Channel) and a green band ( Bollinger Band ).

When the Keltner is bigger ( containing inside) the Bollinger then there is a Squeeze Signal ( red dot on the Squeeze Indicator at the bottom ).

The rectangles are the Darvas boxes, and these are used to define the breakout zone ;

The way to trade this setup is using bracket orders ;
Buy Stop above the box and Sell Stop below the box.
We can use an offset in ticks, where the orders must be placed from the box ; N ticks above for the Buy Stop and N ticks below for the Sell Stop.

So, the logic to trade this setup is as follows :
  1. Wait for a Squeeze Condition ( Red Dot )
  2. Place Buy Stop over Box + Offset
  3. Place Sell Stop below Box - Offset
  4. If one orders get filled, cancel the other
  5. If no more Squeeze condition ( no more red dots ) and orders are not filled, the trade is cancelled
About the settings to use, the Darvas don't need any input parameter, the only inputs needed are for the Squeeze ( Period, Bollinger Standard Deviation and Keltner Multiplier ).
The period is the same for Keltner and Bollinger.
Some good settings to start with are : a period of 20 , a Keltner Multiplier of 1.5 and a Bollinger Standard Deviation of 2.

Please post any comments, suggestions, and question here...
Also if you have a good combination of settings and want to share them, please post them here...

This setup can be traded using the Combo Indicator TIS_Combo_Darvas_Squeeze

Regards,


Thursday, December 20, 2012

Best Indicator for NinjaTrader

Several people asked me about which is the best indicator to use...
In my humble opinion it is not related to a specific indicator but to a group of indicators, and the most important is to choose the correct ones and how to set them all together to find an edge.
In the following example I will show you how the Small Range Setup uses a different group of indicators to filter a setup from different scopes ;

The following is a GOLD ( GC 02-13 ) Chart of today ( Dec 20, 2012 ) 


On this setup I use a trendline ( blue exponential moving average )
an envelope ( gold envelope of 8 ticks size around a 17 moving average )
and Donchian Channel of 13 bars.
When the envelope is all below the trendline we are in sell mode...
A bar can trigger a signal, only if it is making equal or higher high for a short, so we check that the high of bar must be touching the Donchian Channel.
If all of these conditions align, then we place a sell stop 2 ticks below the signal bar...
If price continues against our entry we don't get a fill, just another bar with better entry, until the envelope touches the trendline again and the trade is discarded.
On this example, we keep moving our entry up for several bars until we get a fill at 1659.4
The stop must be placed 2 ticks above the high of the entry bar ; 1660.8 so we are risking 1.4 points = $140 per contract.
We usually should go for 1.5 to 2 times the range of the chart as first target ( 15 to 20 ticks ). On this example the move was enough to get 6 points ( $600 ) per contract.
I created a dedicated indicator to follow this setup that does all the calculations, paint the bars, show the indicators used and also places a diamond where you need to place the order... Really easy... More info Here
On instruments like gold or crude oil we should always take into account the option of using trailing stops, because these markets offer great potential.
There are several ways to manage a trailing stop, and that may be one of my next posts...

Regards,

Pablo Maglio

Tuesday, December 18, 2012

Small Range Setup

New Setup : Small Range

http://goo.gl/w7s7N

This is an old setup focused to trade trending and/or impulsing markets in the direction of the trend.
The Entry Type uses Stop Orders as it is intended for fast volatile never returning markets like crude oil or gold.
This setup uses the following Tools :
  • A slow Moving Average to define the Trend (blue line)
  • An envelope around a fast moving average to define the trade / no-trade condition
  • A channel to verify that the entry bar is making an extreme of the move
  • A tool to calculate the range of the bar ( not used on range bars)
When the blue line is all outside the envelope, the setup has a trend. Otherwise it is in neutral state ; gray bars = do nothing.
If we have red bars and current bar is touching the upper channel, then we have a possible short entry.
When not using range bars we can add another condition ; signal bar must be of small range ;

The short entry is a Sell Stop some ticks below signal bar ( usually 2 to 3 ticks ).
If at next bar we have a better entry we move the order to new place, like on example above.
Once the entry is filled, the stop should be placed some ticks above the signal bar.
Using range chart is easy for this setup because the stop is a fixed value ; the range of bar + 2 times the offset. On a 9 range CL chart using 3 ticks as offset, the stop is 15 ( 9 + 2 x 3 )
I have a developed a special indicator for this setup on www.theindicatormarket.com

Friday, December 14, 2012

The Indicator Store New Web Page

The Indicator Store estrena nuevo sitio
...ahora con muchos mas productos y facilidad de busqueda y compra.

The Indicator Store has new Web Page !
..now with a lot of products and an easy to use interface to browse and purchase.

Sunday, November 18, 2012

Thursday, November 15, 2012

Tuesday, September 18, 2012

Impulse Mode Setup

Impulse Mode

As we all know, one of the most profitable types of Market is the Impulse Mode.
Once the impulse mode is established, there are lower than average or not pullbacks at all, so it is very difficult to enter the market until the move is finished.
This is the reason why it is so important to determine when the market is ready to start an impulsive move and get into the last pullback.
The definition of this rule is critical to avoid to take a lot of fakes moves, but even taking several failures, the profit potential is so big that compensates taking several loses before the final winner.

The rule I use to define when a market is about to start a trending mode is the Bollinger Crossover and it works as follows ;
We need a fast moving average and a slow Bollinger Band. And the the settings we must find are those that make the fast moving average to stay inside of he Bollinger on sideways and even slow trending markets.
When we get a Bollinger crossover ( Fast moving average crossing outside of the Bollinger Band) , then the setup is trade ready in the direction of the crossover, and the entry is a limit order at the middle of the band
See attached picture :


I created a set of Indicators to trade this setup :
PM_Bollinger_XO : It draws vertical lines and triggers audible and text alerts at crossovers. It is possible to filter only the first signal on each direction ( like on the picture )
PM_Trend : It paints bar colors according to the setup

For those who like doing research ( like me ) or auto trading a setup, I also created the strategy PM_Impulse_v2 :


I will post my research on different markets here and if you want to share any setting, info , comment or suggestion, please feel free to do it...

Regards,
Pablo Maglio
www.TheIndicatorStore.com

Thursday, September 6, 2012

Trading a Moving Average

Is it possible to define a trade system only with a moving average (MA) ?
That would be something like this ;
If price is above the MA then we place a limit order at its price value...
If price is below, then we place a sell limit at the MA price value...
We could also define a zone where no trades should be placed...
...let say, while price is too close the MA, then we have no trend ; so no trades.
If price goes far enough from the MA, then we have a defined trend, so we start chasing the MA.
Sounds easy...but ;
Can we find a combination of timeframe and period of MA that produces results ?

I created a long time ago a strategy that exploits that edge, it is called PM_EMA and its first purpose was just that ; find good moving averages to work with...

Using the Strategy Analyzer Tool on Ninjatrader we can run an optimization process where we test the strategy using a range of moving averages, and then create a chart where we can get the PnL vs period ( see attached picture )


The horizontal axis represents the period of an exponential moving average, the histogram is the Profit/Loss of trading it with fixed target and stop. The red line is the number of trades ( its value is on the right vertical axis ).
So we must find the best spots where the profit is maximized and the number of trades is low enough to cover the comisions...

I started this thread to all those followers as me to discuss the best settings we find about this setup.
Regards,
Pablo

Tuesday, August 21, 2012

Introducción a Sistemas de Tendencia

La mayoría de los Sistemas actuales de Trading utilizan uno o varios indicadores dedicados y reglas complejas. Muchas veces es necesario automatizarlos para poder seguirlos sin cometer errores. Para un principiante, lo mejor es empezar con un Sistema que utilice reglas claras y fáciles de aprender y seguir. En esta nota vamos a desarrollar un Sistema que opera en momentos que hay Tendencia definida y utiliza indicadores convencionales, de los que cualquier plataforma ofrece. Para seguir este sistema vamos a necesitar Bandas de Bollinger y Medias Exponenciales. Con este sistema no solo podremos definir la tendencia, sino también cuantificarla e incluso detectar cuando el mercado analizado pasa de un movimiento de tendencia fuerte a completamente impulsivo. Los movimientos impulsivos son los que más relación Ganancia/Riesgo ofrecen, y usualmente conviene operarlos con trailing stops en lugar de Objetivos fijos. A continuación veremos la confección del grafico para seguir este sistema. Dado un Mercado y un Marco de Tiempo comenzamos por agregar al gráfico 3 Bandas Exponenciales de Bollinger con Periodo 200 y Número de Desvío Standard 0.5 , 1 y 2. Luego agregamos una Media Exponencial Rápida de Periodo 17.

tabla 1
 tabla 1


Mientras la Media Exponencial rápida de periodo 17 “EMA(17)”se mueva dentro de la banda menor, el sistema está en modo neutral, y es un indicio de que el Mercado esta en consolidación. En cuanto la EMA(17) se salga de la primer banda, el sistema entra en modo tendencia ; Si superó la banda superior la tendencia es alcista, si superó la banda inferior, la tendencia es a la baja. En un caso simple de tendencia alcista, donde la EMA(17) no va mucho mas lejos de la primer banda sin llegar a atravesar marcadamente la segunda banda, la entrada de compra clásica es en la mitad de la banda, o sea en la EMA(200) con un Stop promedio ubicado entre la primer y segunda banda ; 

tabla 2
 tabla 2


Los objetivos también pueden determinarse con las Bandas de Bollinger, como se ve en el grafico adjunto, siendo cada una de las Bandas subsiguientes un posible objetivo. Para el caso particular de este ejemplo, luego del objetivo 2 hay una re-entrada en la EMA(200) ya que luego de obtener el objetivo 1 se volvió a producir un cruce de la EMA(17) con la primer Banda. En este caso esta entrada funcionó muy bien, aunque estadísticamente las mejores operaciones son las primeras luego de cada cambio de tendencia. En el ejemplo siguiente se puede observar un caso de Impulso : Cuando la EMA(17) no solo pasa la segunda Banda sino que casi toca o sobrepasa la tercera, podemos considerar que el mercado ha entrado en modo Impulso y que debemos buscar entradas más agresivas que en la EMA(200). Lo usual es utilizar la banda previamente atravesada como entrada y usar la misma o la anterior como trailing stop: 


tabla 3
 tabla 3


Este sistema, a pesar de ser sencillo no deja de tener muy buena performance. Puede utilizarse en cualquier mercado (Forex, Futuros o Índices de Acciones ) y en distintos Marcos de Tiempo. En el siguiente ejemplo puede verse este sistema aplicado al futuro del Crudo en un marco de Rango 5, donde cada operación tiene un riesgo máximo de 15 ticks ( usd 150 x contrato ) y objetivos del orden de 40 ticks ( usd 400 ). Este es un grafico muy rápido con muchas operaciones por día, lo cual demuestra que el sistema es aplicable a cualquier mercado. 

Por Pablo Maglio

Friday, August 17, 2012

PM_EMA

http://www.screencast.com/t/


wfOXiSI4cvAu
One of my best strategies that can be configured to be profitable in all kind of markets, from crude oil to bonds
This is the performance on crude oil trading just 1 contract with 15 ticks of target and stop