
The best Indicators and Strategies for NinjaTrader
Saturday, June 1, 2019
Sunday, April 14, 2019
VWAP - Promedio de Precio Ponderado en Volumen
Este indicador calcula el Promedio del Precio ponderado por el volumen de cada barra.
Eso significa que el valor de esta línea es la suma del precio promedio de cada barra multiplicado por el volumen de esa misma barra y finalmente dividido por el volumen total.
Ahora, dependiendo de cuándo comenzamos a contar el volumen (y también restablecemos el conteo), tenemos diferentes opciones para el Vwap.
Los valores más utilizados son el Vwap de 24 hs, donde contamos el volumen total desde el final de la sesión de ayer (línea azul).
También podemos considerar solo la sesión del día, así que comenzamos a contar el volumen desde ese momento. ( línea roja )
Y también podemos hacer el promedio comenzando la suma del volumen al inicio de cada semana. ( Línea verde )

En este video donde presento la nueva versión del indicador TIS_Vwap para NinjaTrader 8 (que también incluye la versión para Ninjatrader 7) explico cómo funciona y muestra algunos ejemplos:
Compre este indicador en nuestro sitio : TIS_VWap for NinjaTrader
Eso significa que el valor de esta línea es la suma del precio promedio de cada barra multiplicado por el volumen de esa misma barra y finalmente dividido por el volumen total.
Ahora, dependiendo de cuándo comenzamos a contar el volumen (y también restablecemos el conteo), tenemos diferentes opciones para el Vwap.
Los valores más utilizados son el Vwap de 24 hs, donde contamos el volumen total desde el final de la sesión de ayer (línea azul).
También podemos considerar solo la sesión del día, así que comenzamos a contar el volumen desde ese momento. ( línea roja )
Y también podemos hacer el promedio comenzando la suma del volumen al inicio de cada semana. ( Línea verde )
En este video donde presento la nueva versión del indicador TIS_Vwap para NinjaTrader 8 (que también incluye la versión para Ninjatrader 7) explico cómo funciona y muestra algunos ejemplos:
- https://youtu.be/ylJFf74kV3I
Best Regards, Saludos,
Pablo Maglio
 |
|
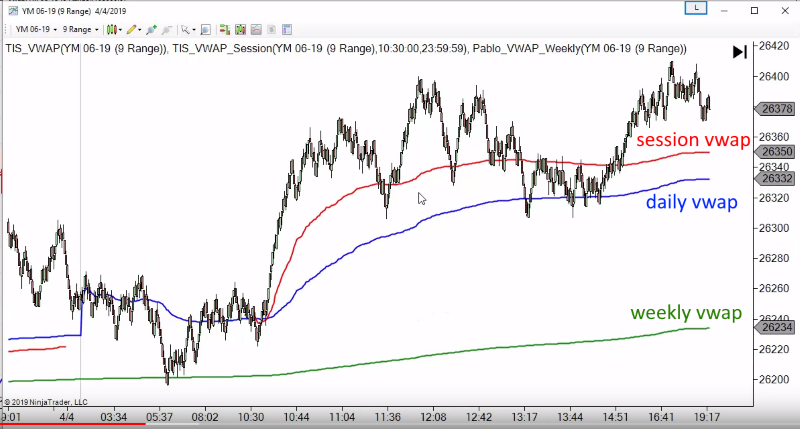
VWAP - Volume weighted Price Average
VWAP - Volume Weighted Price Average
This indicator calculates the Average of the Price weighted by the volume of each bar.
That means that the value of this line is the sum of the average price of each bar multiplied by the volume of that same bar and finally divided by the total volume.
Now, depending on when we start counting the volume ( and also reset the count ) then we have different options for the Vwap.
The most used values are the 24 hs Vwap, where we count the total volume starting from the end of yesterday's session ( blue line ).
We can also consider only the day session, so start counting the volume at this time. ( red line )
And also we do the average starting the sum of the volume at the beginning of the week. ( green line )
On this video where I present the new release of the indicator TIS_Vwap for NinjaTrader 8 ( that also includes the version for Ninjatrader 7 ) I explain how it works an show some examples :
Purchase this indicator on our site : TIS_VWap for NinjaTrader
This indicator calculates the Average of the Price weighted by the volume of each bar.
That means that the value of this line is the sum of the average price of each bar multiplied by the volume of that same bar and finally divided by the total volume.
Now, depending on when we start counting the volume ( and also reset the count ) then we have different options for the Vwap.
The most used values are the 24 hs Vwap, where we count the total volume starting from the end of yesterday's session ( blue line ).
We can also consider only the day session, so start counting the volume at this time. ( red line )
And also we do the average starting the sum of the volume at the beginning of the week. ( green line )
On this video where I present the new release of the indicator TIS_Vwap for NinjaTrader 8 ( that also includes the version for Ninjatrader 7 ) I explain how it works an show some examples :
- https://youtu.be/B4I4QsLoz5k
Best Regards, Saludos,
Pablo Maglio
|
|
Thursday, March 14, 2019
Test & Automate Your Ideas with Markers Plus ‘The Force’
New Release of Markers Plus System : "The Force"
Join Us on this FREE Webinar and Learn about The Force
Date: April 04, 2019
Time: 4:15 pm ET
Presenter: Pablo Maglio

Time: 4:15 pm ET
Presenter: Pablo Maglio

Sunday, September 2, 2018
Friday, May 18, 2018
Monday, May 7, 2018
TIS_NHABars


For an Up/Down Signal :
1) N Up/Dn Bars
2) N BArs with a Higher/Lower Close
3) N Bars with a Higher/Lower High
4) N Bars with a Higer/Lower Low
5)
 N Bars with a wick at the Top
6)
N Bars with a wick at the BottomThe Bars are defined as Up/Dn Bars by their Color, which can be the corresponding to the HeikenAshi Smoothing or the Standard Color
.This means that this indicator can also paint the classic NBars Signals.
Some other features :
1) Paint the background acording to the last signal detected
2) Adding a Plot with possible values of { +1 ; -1 } cording to the last signal, so it can be used as a filter
3) Option to add an expiration of the trend after a defined number of Bars.
4) Option to Repeat Signals on same direction.
Subscribe to:
Posts (Atom)