Saturday, February 27, 2016

Trade Setup Examples : Defining Entry Signals

Entry Signals


There are different ways to Trade a Market, no matter what Instrument or Time Frame, we must analyze which works best ;

I would classify the possible Setups in 2 Ways ;

  1. Trade Breakouts
    We must define a rule to specify an area ( over and below the market ) that once broken will trigger an entry signal ; a long when the area is broken to the upside, and a short when broken to the downside.
  2. Trade Pullbacks
    We must define a rule to calculate the Trend.
    When it exceeds a threshold, then we are trade ready to enter on a retracement


Some instruments can be traded better on one mode than the other.
The combination of instrument and timeframe is also important, because the same instrument can perform better with breakouts on one time frame while working better with pullbacks on other.

Examples :

This is a 5 Minutes EURUSD Forex Chart


If we use the last 8 Bars Pivot ( we can use the Swing(8) Indicator) then we can define our breakout area by the last detected upside pivot and last detected downside pivot.
The Breakout Entry method could then be placing bracket Orders at those levels ;

  • Buy Stop at Green Line Level
  • Sell Stop at Orange Line Level


As we can see, when the market is very volatile the results are excellent.
But when it moves sideways, like at the end of the session, we start having some fake breakouts, like at the end of the day, between the 2 blue arrows, there was a failed breakout to the downside ( orange line just moved a few ticks lower )


On the next picture we have the same Chart with an example of a Pullback Entry ;
We use 2 lines ; a fast (bue) and a slow (black) moving average.
When the blue crosses below the black we start looking for a short at a retrace to the black line.
We can trade only first, second, or N retracements.
Until the blue line crosses above the black, and then we start looking for a long at a retrace to the black.


Here we have an example on Crude Oil ; only 2 trades with a pullback entry ;


Using the breakout entry doesn't looks good on this Chart ;


( each time we see a lower orange line there is an entry, but the available profit is too small)

But if we change the time frame for the same day, now the setup looks much better ;


With these concepts, we can identify on our preferred Instrument and Chart Combination
which is the best Setup Mode to Use.

On the following posts I will cover different ways to configure both Setup Modes ; Breakout and Pullback

Please post any question or comment below this post.


photo
Skype Skype id : pmaglio


Thursday, February 25, 2016

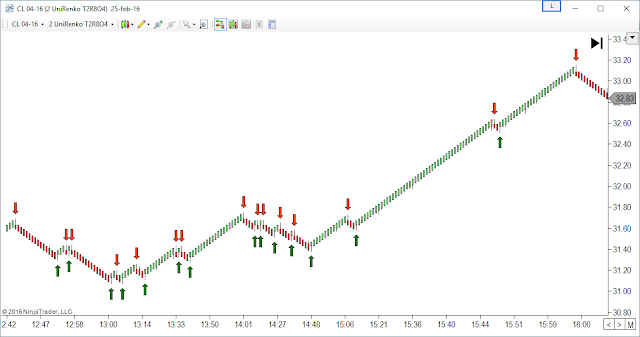
Trade Setup Examples : High Time Frame Filters

High Time Frame Filtering

Filtering our signals taking into account the trend defined on a Higher Time Frame is one of the most important factors to take into account.

We can see on these Charts some Examples :

This is a High Time Frame Crude Oil Chart, very slow for Day Trading, where each bar has a Size of 18 Ticks, too big for the precision of an average day trading trade, where we use targets and stop near or lower those 18 Ticks.


But if we go back to our Trading Chart, much faster than this one, where we can have several Up and Down signals during one single bar of this slow Chart, which of these trades will have more Odds to Succeed ?

It is evident that we can get much better targets and less losers if we filter these signals using the higher timeframe trend.

Now, How we define the Trend ?

1) OpenClose
The example shown here ( 1st Chart ) is the easiest way ; while bars are closing up (green), the Trend is Up. When bars are closing down (red), the Trend is Down.

This is the faster and easier way to define the trend, and using some kind of fine tuning with Renko Bar we can avoid having noise or fast trend changes on sideways


  • We can see an example on Gold on this post


There are lot of other ways to define a trend ;

2) Moving Average Slope ( We can use SMA, EMA, HMA, etc )
Looking at the slope of a moving average is the 2nd fastest way to define a trend, and we can add a threshold to filter out noise.
On this example I'm using an EMA(34) and we can see that we get the same trend signals than on the OpenClose

Using the Markers Tool Slope we can measure this Trend and have it available on any other Chart, no matter what time frame or instrument.

Now, on our working chart we can specify a Markers filter for long and shorts this way ;

Markers will automate any detected signal only if the corresponding side filter is in agreement.


3) Relative Position of 2 Lines ( We can use SMA, EMA, HMA, etc )
We use 2 lines ; a fast moving average and a slow moving average.
When fast is above the slow the trend is up, when it is below, the trend is down.
The faster the periods and the closer the fast and slow periods, the fast the signal we get.
On this example, we have an EMA(36) [blue] and an EMA(34) [red]
We can see that the signals ( Arrows ) have some delay and filtering in relation to the OpenClose trend direction

To apply this method using Markers Tools, we need to copy both lines and then use the XO Indicator to calculate the distance between them ;

In total we use 3 indicators ; 2 Copy instances and one XO.
The variable defined on XO ; ema34vs36 is available on all charts and can be used to filter our signals as on previous method.
We can filter longs when ema34vs36 is greater than zero or a positive threshold.
...and shorts when it is smaller than zero or a negative threshold.


Having defined the Trend ( on current or higher time frame chart ) now we can focus on the signals of the work chart, usually the fastest time frame.

We will see some examples on the following posts.

Best Regards,
Pablo Maglio

photo
Skype Skype id : pmaglio


Defining a Trade Setup

Beginner's Guide to Define a Trade Setup

Hello Everyone !

On this Article I will explain the basics on defining and executing a Trade Setup.
It doesn't matters if we are analyzing Forex, Futures, Stocks or any other instrument, the rules are the same and they work anywhere.

An important step we must follow to document what are we doing is to write the rules in a way that anyone can understand and trade in the same way.

As a suggestion, try to avoid long and complex conditions and try to differentiate the setup into these 3 different items :

  1. Entry Trigger
    A group of conditions that when all in agreement trigger an Entry Signal
  2. Filter Conditions
    A group of conditions that must agree to accept an Entry Signal
    Usually we can put all these conditions together with #1
  3. Exit Trigger
    A group of conditions that when all in agreement trigger an Exit Signal.
    Any remaining position is closed when this happens.

Examples of #1) Entry Trigger

  • Fast Line crosses above Slow Line to Enter Long
  • Oscillator leaves oversold area to Enter Long
Examples of #2) Filter Conditions

  • System is already Long ( so we dont add more position )
  • System is Short ( so we wait this position to finish at target or stop )
  • Higher Time Frame Filter is not aligned
Examples of #3 Exit Trigger can be similar to #1


With Markers Plus, now we can Create, Visualize and Auto Trade any Logic that we define :


On the Following Post I will show several Trade Setup Examples and its implementation using Markers Plus Tools

Best Regards,
Pablo Maglio

photo
Skype Skype id : pmaglio