This setup is the confluence of 2 different Trade Setups :
Setup #1 : Darvas

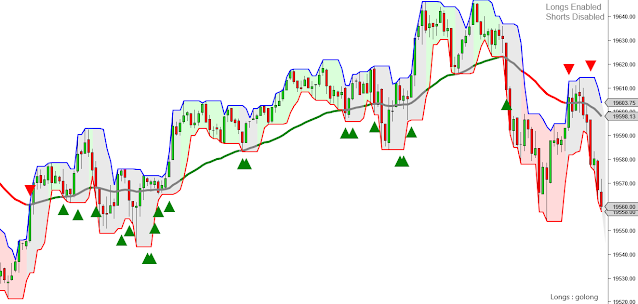
The Darvas Indicator is included with NinjaTrader and it draw 2 lines as shown on the picture
When the price crosses one of the lines it is a signal.
The only special consideration about this indicator is that it redraws, so what we see on the Chart is not what is visible real time, but once the box is drawn in real time, if the price breaks it we have a signal.
This system has no parameters, so the only variable we have is the timeframe, and also it is suggested to filter it with some other tool, as we are doing here.
Setup #2 : Squeeze

- Bollinger
- Keltner Channel
The Bollinger envelope lines visible in orange on the picture, are following a simple moving average of the Close.
The distance between the upper envelope and the midline is X times the Std Deviation of the last N Bars, where N is the Period of the SMA ( Simple Moving Average )
The Keltner envelope lines visible in Cyan on the picture, are following a simple moving average of the Median.
The distance between the upper envelope and the midline is Y times the ATR of the last N Bars, where N is the Period of the SMA ( Simple Moving Average )
As we can see on the picture the center line of both envelopes is slightly different because both are SMA's with the same Period, but one is looking at the Closes while the other at the Medians, but the difference can be ignored as it is less than 1 tick.
As we can see also on the picture, the are where the market is on sideways the bollinger ( blue lines ) is inside the keltner ( cyan lines ).
We will name those as squeeze bars.
When the Bollinger gets outside of the Keltner we get a Squeeze Signal.
Those Squeeze Signals dont have direction, so we need to decide if entering long or short by looking somewhere else.
One possible method is looking at the slope of the midline, so we take longs or shorts depending if the slope is positive or negative.
Another option is using a different trade setup as we are doing here :
On the Darvas Squeeze Combo we search for a Squeeze Signal ( with no direction ) near a Darvas Signal ( which has a direction ). And when both signals are close enough, at no more than Z Bars of distance then we have a combo signal.

Custom Indicator TIS_Darvas_Squeeze
The Parameters of this indicator allow to define any of the Darvas, Bollinger, Keltner settings and also some parameters of the Setup :
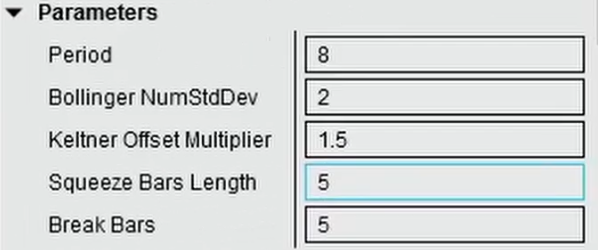
- Period : this is the Period of the SMA, Bollinger & Keltner, the ATR ( used by Keltner ) and Std Dev ( used by Bollinger )
- Bollinger NumStdDev : is the multiplier of the Std Dev used on the Bollinger
- Keltner Offset Multiplier : is the multiplier of the ATR used on the Keltner.
- Squeeze Bars Length : is the number of squeeze bars required to trigger a Squeeze Signal
- Break Bars : is the max distance in bars between the Squeeze and DarvasSignals
Youtube Videos :