Monday, July 28, 2025

πŸ”„ Unlocking Signal Automation in NinjaTrader 8 with Coral Trend & ADX_VMA

 πŸ”„ Unlocking Signal Automation in NinjaTrader 8 with Coral Trend & ADX_VMA

Automation is no longer optional for traders aiming to stay competitive — it’s essential. With the latest updates to TIS_Coral_Trend and TIS_ADX_VMA, The Indicator Store is empowering traders to transform visual insights into actionable, automated strategies in NinjaTrader 8 — without a single line of code.

In this post, we explore how these upgraded indicators work, how to fine-tune their signal sensitivity, and — most importantly — how to copy their signals directly into Markers for seamless strategy automation.


🎯 Coral Trend: Visual Slope Detection with Precision Control

The TIS_Coral_Trend indicator uses a slope-based algorithm to identify trend direction changes in real-time. But the key innovation lies in its signal generation and automation compatibility.

Key Parameters:

  • Period: Controls how reactive the line is to price changes. Lower values = faster reactions.

  • Constant D: A sensitivity multiplier. Higher values = more signals, including intra-trend fluctuations.

Together, these parameters allow you to calibrate the indicator from ultra-conservative to hyper-sensitive — ideal whether you're swing trading or scalping.

The signal plots (Signal Up, Signal Down) are now fully exposed as plots, which means you can instantly copy them into Markers or the Strategy Builder.


⚡ ADX_VMA: Momentum Meets Volatility

The upgraded TIS_ADX_VMA combines ADX-driven volatility with dynamic signal output for:

  • Long Entries when trend strength rises

  • Short Entries when trend reverses

  • Exit Signals when momentum fades

Customizable Parameters:

  • ADX Period: Defines the historical window for trend strength.

  • ATR Sensitivity: Sets the threshold for filtering out weak signals.

Want fewer, more meaningful signals? Increase sensitivity. Want rapid feedback? Lower it. The flexibility here gives you surgical control over your entries and exits.


🧠 From Plots to Power: Automating with Markers 2025

The real game-changer is the ability to copy plotted signals directly into Markers 2025 — turning any visual signal into a functional rule within your trading strategy.

Here’s what you can do:

  • Copy plots from Coral Trend or ADX_VMA into Markers

  • Assign them as fast signals for immediate execution

  • Build logic conditions using Markers' intuitive interface

  • Define time filters, order types, ATM strategies, and risk limits

This setup makes your strategies not only reactive but fully modular. You can build a setup once and reuse or adapt it endlessly.


πŸ’‘ Why It Matters

Manual trading is reactive. Semi-automated trading is scalable. But fully automated trading is where consistency, discipline, and edge truly converge.

By combining Coral Trend or ADX_VMA with Markers 2025, you unlock:

  • ✅ Visual logic without coding

  • ✅ Modular system design

  • ✅ Multi-account trade replication

  • ✅ Compatibility with any plotted signal


#TheIndicatorStore #NinjaTrader #Automation #TradingTools


Wednesday, July 23, 2025

Multi-Strategy Synchronization with Markers 2025

  Multi-Strategy Synchronization with Markers 2025


🧠 Smart coordination to avoid conflicting trades

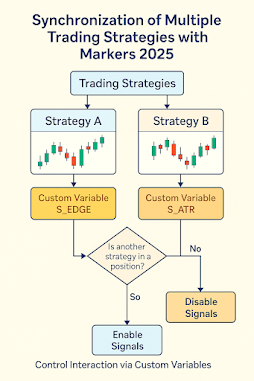
Managing multiple trading strategies simultaneously often leads to overlap — duplicated trades, unintended exposure, and unnecessary risk. Markers 2025, a feature from The Indicator Store for NinjaTrader, addresses this by allowing strategies to share their status via custom variables.

These variables act as communication bridges, containing information such as whether a strategy currently holds a position, its entry price, or floating P&L. Other strategies can then check this data before executing, avoiding conflicts and ensuring trades aren't opened if another system is already active.

For example, a trader might set a condition to only execute long trades if another strategy’s position variable equals zero. These state checks are performed in real time and can be visualized directly on the chart, thanks to the global nature of the variables.

This transforms the trading environment into a more intelligent and risk-aware system, where each strategy operates independently but is contextually aware of others — a hallmark of collaborative algorithmic trading.


Thursday, July 17, 2025

🧠 How to Generate Flexible Performance Reports in NinjaTrader 8

 πŸ§  How to Generate Flexible Performance Reports in NinjaTrader 8 (and Analyze Them with Excel or Google Sheets)


Performance analysis is key to optimizing your trading strategies. In this guide, we’ll show you how to generate a complete report directly from NinjaTrader 8, export it in seconds, and turn it into a visual report using Excel or Google Sheets.
This approach is ideal for reviewing each strategy separately and making better, data-driven trading decisions.

πŸ“Š Step 1: Generate the Trade Performance Report in NinjaTrader

NinjaTrader offers a built-in Trade Performance feature that lets you review your trades over a specific period. You can filter results by:

  • Account

  • Instrument (e.g., Nasdaq or S&P 500)

  • Strategy or ATM template

This gives you a quick overview of your total performance and lets you isolate results for each setup you’re running.

πŸ’‘ Pro tip: If each setup runs under a different account name, you can easily compare their performance using the “Account” filter.


πŸ“ Step 2: Export Your Trades as a CSV File

Once the report is generated, simply right-click on the table and select Export. This creates a .CSV file you can save and transfer to your local machine.


πŸ“₯ Step 3: Import and Analyze with Excel or Google Sheets

Open a blank spreadsheet and upload the CSV file. You’ll see all trades listed with key fields like entry time, account, instrument, and profit/loss.

At this point, you can build a pivot table to organize and explore your data however you want.

Some useful breakdowns include:

  • Strategy performance by date

  • Comparison by account or setup

  • Net profit by instrument

  • Number of trades per day/week


πŸ“ˆ Example: Comparing Setups by Date and Instrument

A pivot table allows you to build something like this:

DateSetup A   Setup B  Setup C
Monday+$450-$120        +$80
Tuesday+$210+$50    -$40
Wednesday+$0+$340    +$130

You can also filter by instrument, group trades by week or month, and even visualize results using charts.

 Smarter Reports, Better Decisions

With this method, you can turn raw trade data into clear, customizable reports — helping you understand what’s working, what needs adjustment, and how to optimize your strategy mix.

πŸ” Watch the full video where we walk you through each step:


πŸ’¬ Got questions? Join our free community on Discord


Thursday, July 10, 2025

πŸ” How to Create Trading Signals Without Coding: Introducing Markers for NinjaTrader


πŸ” How to Create Trading Signals Without Coding: Introducing Markers for NinjaTrader

If you're a trader looking to automate signals without writing code, Markers by The Indicator Store is exactly what you need. This suite of tools for NinjaTrader empowers you to build powerful logic-based signals using a fully visual interface—ideal for discretionary traders, semi-automated systems, or those just getting started with strategy building.

🎯 What Is Markers?

Markers is a collection of NinjaTrader tools designed to simplify the process of generating and using custom signals. You can detect indicator behaviors like slope changes, crossovers, and more—without touching a single line of NinjaScript code.

🧩 Key Tools and What They Do

✅ Marker Slope

This tool detects changes in the slope of any indicator line (e.g., HMA, EMA, SMA). You can set a threshold to trigger signals only when the slope is steep enough—avoiding false entries in choppy markets. Signals can be visual (e.g., background color) or logical (for automated execution).

✅ Marker Copy

Use this tool to clone any indicator’s line so you can reference it elsewhere. For example, you can copy an SMA(100) line and use it as a baseline to compare against price or other indicators.

✅ Marker Crossover

This tool lets you create crossover conditions:

  • Price crossing an indicator line

  • One line crossing another (e.g., fast vs. slow moving average)

You can also apply distance thresholds, triggering a signal only if the crossover happens with enough “strength” (measured in points or ticks).

πŸ” Combine and Automate

All three tools are compatible with each other, meaning you can:

  • Detect slope + crossover

  • Filter by copy-based distance

  • Stack conditions visually
    And if you're using Markers Plus, these signals can be executed live using market or limit orders.


πŸ“Œ Why Use Markers?

  • No coding required

  • Fully visual logic

  • Works with any indicator

  • Ideal for discretionary traders and system builders

  • Compatible with automated execution via Markers Plus


πŸŽ₯ See It in Action

The full video tutorial is available on our YouTube channel, where we show exactly how to set up each signal and use thresholds to improve accuracy.

Join our free Discord community for support, strategy ideas, and direct help from other NinjaTrader users.


Saturday, July 5, 2025

How to Detect Multi-Timeframe Confluence in NinjaTrader Using HMA Slope

 Master real-time logic for better trading decisions across charts with different time bases (minute, volume, range, Renko)

Working with multiple timeframes is a common technique in advanced trading analysis. However, combining signals from charts with non-linear bases (such as minutes, volume, range, and Renko) presents a real challenge: these bars do not align in time or proportion.

This post summarizes a video walkthrough where we demonstrate how to overcome this issue in NinjaTrader, using a practical example: tracking the slope of a Hull Moving Average (HMA 50) across four different chart types.

The core idea is to copy the same HMA indicator across all charts, giving each instance a unique name (e.g., HMA_50B, HMA_50R, HMA_50U) to avoid conflicts between global variables.

We then compare the slope in real time by checking if the current bar of each HMA is greater than the previous bar. When all slopes agree (e.g., all sloping up), this multi-timeframe confluence becomes a powerful entry signal.

⚠️ Note: Historical signals can be misleading due to lack of bar synchronization. This method is intended for real-time or playback analysis only.

We also explore how to store each slope condition into a variable (e.g., minutes, volume, range, renko) and evaluate confluence from a separate chart by comparing all variables in a single logic condition.

Finally, we show a simplified version: checking all slope conditions directly within a single formula. This is faster but harder to maintain and cannot be monitored from a central chart.

Why this matters?
Detecting real-time confluence across charts increases confidence in your entries and avoids false signals from isolated indicators.


Want to go further?
In a future video, we’ll explore how to do the same using indicator signals instead of slope logic. Let us know if you're interested.

▶️ Watch the full video