Search This Blog

Showing posts with label New Indicator. Show all posts

Saturday, January 18, 2014

Supertrend Setup for Ninjatrader

Hello everyone !

Most of you may already know the Supertrend Indicator, it has been available for most platforms including Ninjatrader.
There are several versions, some of them free and including different calculation modes.
It is basically a trend detection systems very useful also for trailing stop management purposes.
On the following chart we can see the trend changes indicated by arrows when the line is calculated with the default settings ; an HMA(14) and a multiplier of 2.618

and on the following chart, the HMA is changed by the Median ;

Using an SMA :

Same SMA, but changing the multiplier from 2.618 to 1

As we can see, this is a very flexible and powerful indicator to define trend and reversals.
If we are in the Market, the indicator can be used to keep the trailing stop slightly below its line.
If we are looking for an Entry, once a trend change is detected ( red and blue arrows are painted ) we have several options :
  • Enter at Market
  • Wait for a pullback with a Limit Order Entry
If we decide to use the pullback entry option, then we need to define How to Calculate the Entry.

A suggested approach is using same line study used for the supertrend but with a slower period.
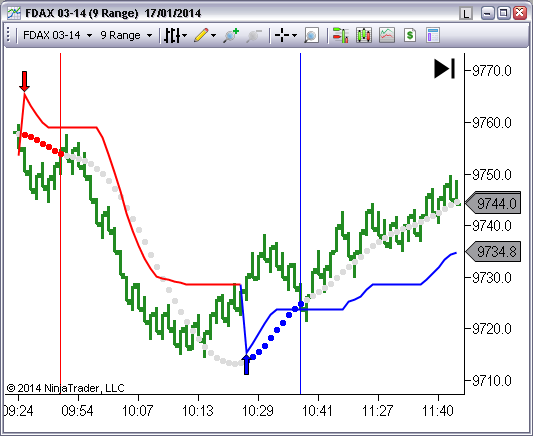
Lets review the SMA example where the supertrend is calculated with an SMA(8) and a multiplier of 2.618.
Now we add an SMA(17) ( dotted line ) and we have a complete trade setup :
Once we have a trend change ( arrow ) we place a limit order at the SMA.
On the following chart we can see a short at red dotted line and then a long at blue dotted line.
Entry time bars are marked with vertical lines :

Another example with HMA : supertrend with HMA(10) and Entry with HMA(50)

How to Manage the Trade

It is evident that this system will get the best results on impulsive and trending markets when we use runners.
When holding a position and using a trailing stop, at some time the trend will lose impulse and there will be a reversal.
For example, on the following Chart we can see a long filled after 4 or 5 bars of the arrow up :
If our trailing stop is big enough to survive all the way up and then we get a red arrow down we have several options ;
  • Close the long after a red down arrow is painted
  • Leave the position alone being managed by its trailing stop
  • Reverse the Long Position at New Short Entry ( red dots ) assuming the long trailing stop is not triggered.
On The Indicator Store we have a Custom TIS_Supertrend Indicator with all the User defined settings to define the Trend and also a user defined Entry as shown on previous Chart.

If you like the Supertrend possible Setups using the rules explained, it can be automated by Markers ; a Semi Automatic and also Full Automatic System that trades all possible trade setups described. 
It has the option of Early Exit; in case we are holding a position, and an inverse arrow ( trend change ) is painted we can decide if closing actual position or not.
If we decide not using early exit, then the current position will be exited at trailing stop or reversed at new entry.

Let me know if you have any question or suggestion...
Best Regards,
Pablo

Thursday, September 12, 2013

New PMS_EMA Semi Automatic Strategy

In continuation with our Project of upgrading all our Systems to the New Format of Semi Automatic System so We can Auto Trade from Chart Trader...

The Indicator Store presents the New version of the PM_EMA Setup :


This package (PMS_EMA) contains an enhanced Indicator with the following Features :
  • Option to Paint Bars according to Trend
  • Option to Draw Envelope
  • Option to Generate Audio and Text Alerts
  • Offset Option ( New on this Version )
  • Option to specify ATM Name to execute
  • Option to execute trade by Trade ( Button disables after each trade )
  • Option to take all signals ( Buttons remains enabled after trade )
  • Strategy works in slave mode, receiving data from the indicator
  • Bidirectional communication between the Indicator & Strategy
    ( Indicator receives acknowledge from Strategy to enable sending orders )
On the following picture we can see an example where the indicator is ready to send orders, and Short button is enabled, so it will take the next Short Signal :

On the next example picture, the indicator can not communicate with the strategy, so it can not send orders.
Possible reasons ; Datafeed not connected, not receiving data for the selected instrument or the Strategy is not Ready...

We will continue upgrading all our Setups to use this New System.
Next to come ; ATR_BarColor, PM_Reversal (New Setup)

If you are interested in automate any other System, please ask...
We can convert any indicator into a Fully Auto or Semi Automatic System...

Good Trading !
Pablo

logo Pablo Maglio The Indicator Store 

Facebook Twitter LinkedIn Blogger Elance

Wednesday, September 4, 2013

New SRS Semi Automatic Strategy

The Indicator Store present its New Line of Semi Automatic Systems

Our First Product using this system is the SRS.

As you remember, with the SRS we get an Audio and Visual Alert indicating a possible entry :


On the Alert Window We can identify the Symbol ( CL 10-13 ) and the possible entry.

So We watch at the CL 10-13 Chart and place the Entry Order ; a Buy Stop over the Cyan Diamond :


We continue updating the Order Entry Price while the Cyan Dot moves...

... or Cancel the Entry Order if Dot disappears and bars turn gray

The New Version of the Semi Auto SRS includes an updated Indicator that places Buttons on the Chart, as seen on previous pictures.
This indicator has the following Input Parameters, including settings for the ATM name, the same that we use on Chart Trader. So we can control the trade size, trailing stop, targets & Stops from the Indicator, by just changing the ATM Name...

Watch this YouTube Video to see how it works :

Please post any suggestion or question...

Regards,
Pablo
logo Pablo Maglio The Indicator Store 

Facebook Twitter LinkedIn Blogger Elance

Monday, September 2, 2013

Selling Tops and Buying Lows on Ninjatrader

Selling New Highs and Buying New Lows are known setups with big Profit Potential when we catch a Reversal. But we can also get several losers in Row on a trending or Impulsing Day.
It is always recommended to have some additional confirming factors over the zone we want to Buy or Sell.

We can add structural factors, like a higher time frame wave possible termination, or well known fib retracement, etc.
The more factors providing from different timeframes, the better odds to succeed in our trade.

Looking at technical indicators, we can also look for divergence and/or overbought/oversold indications. 

For example we can look at the MACD ( red line ) making a higher low while price is making new lows :


We can also look at a stochastic (red line) and watch for 2 things ;
  • red line is over a defined value, so it is over bought AND it is going down
  • red line is below a defined value, so it is over sold AND it is going up
See following picture :


If we filter those conditions on the Stochastic, and replace them by dots ; Cyan Dots for Over Sold ( Buy Signals ), and Red Dots for Over Bought ( Sell Signals )
we get this Chart :

...it looks really nice, but we must remember that dots are calculated ( so painted ) after bar is finished, so it is not possible to enter with limit orders.
See this following example :
That means that we have 2 options ;
Try placing a limit order slightly below the open of Bar, near the Close of Signal Bar, or placing a Buy Stop some ticks over the High of Signal Bar.

On The Indicator Store, we have developed a Reversal Indicator as shown on Previous Pictures, that works intrabar, so it shows unconfirmed Signal Dots. That gives us the time enough to place a stop order. After the bar completes, that signal will become on confirmed, so we can leave the order working, or will be removed, so we can cancel our order.
Take into account that if market keeps going down, the unconfirmed signal will be removed and our buy stop order will stay unfilled, so we have enough time to cancel it.

This is a link to the TIS_Reversal Indicator on The Indicator Store WebSite

On this video it is possible to see it working live


This video with no audio will show some examples on real time :


logo 
Pablo Maglio The Indicator Store 

Facebook Twitter LinkedIn Blogger Elance

Tuesday, July 23, 2013

Volume Profile Indicator for Ninjatrader

New Range Volume Profile Indicator for Ninjatrader

This new Volume Profile Tool allows to define the time window inside the Chart to calculate the Profile.
Even more, we can move the window and see the profile updating real time.

What is a Volume Profile ?

It is a histogram that shows the volume traded at each price taking into account a defined time window.
The prices where most volume is traded are zone that can be considered Support & Resistance.
In the other way, the prices with lowest volume traded are zones without traders interest.

On this example we can see a Volume Profile of Dow Jones taking into account the volume of the last 5 days :

On these charts we can see the profile of one day session and the effect of its peaks on the following session price action :


This can be applied to different markets...
like Crude Oil  :

...and different timeframes, like this one week profile to calculate levels to be used on next week :

Most of the Indicators allow to calculate daily profiles or composite ( from N days into the past ), but with this new Indicator ( TIS_Price_Volume_Range ) now it is possible to define any interval, real time, and even intraday ;

Look at this indicator working live on the following YouTube Video :
Regards,
Pablo
logo Pablo Maglio The Indicator Store 
Facebook Twitter LinkedIn Blogger Elance

Sunday, July 14, 2013

Ichimoku Indicator Setup for Ninjatrader

Ichimoku Indicator Setup for Ninjatrader

Ichimoku is a chart developed by Goichi Hosoda, and was originally intended for daily charts. It is intended to find an equilibrium on the charts and uses 2 moving averages ; 9 and 26. The number 26 comes from the number of days that the Tokyo exchange was open per Month. But all periods can be changed and optimized as we will be using faster timeframe charts instead of daily.


Lines of the Ichimoku :

  • TenkanSen ( fast moving - 9 bars of period )
  • KijunSen ( slow moving - 26 bars of period )


Cloud of the Ichimoku

Shaded area between 2 lines :

  • Senkou Span A ( average of 2 moving averages, and delayed 26 bars into the future )
  • Senkou Span B ( moving average of 52 bars delayed 26 bars into the future )
The Cloud can be used as a Support and Resistance Level ; it has different color depending on the relative position of the Sekou A and Senkou B Lines.

We can use a crossover of the fast and slow lines ( TenkanSen vs KijunSen ) as a trigger signal, and then watch for 2 additional conditions ;
  • Entry is above the Cloud, so we dont trade against it
  • Cloud Color if same sign as current trade
On the following Chart we have an example of a Long Entry on a Standard and Poors ( ES ) Daily Chart :


This ES Long On happened on ends of 2011, last days of December in the area between 1170 to 1200.
Next Short Signal ( against the cloud ) happened on April 2012 at the 1350-1370 area with more than 150 ES points in just 4 months.


On the following Chart we can see the end of the Trade using a Counter Trend signal of same setup as an exit for the Initial Trade :


The Cloud is also useful to define the size of the support zone and the stop needed for the trade.

We can also change the default 9,26,52 settings when applying this setup to faster timeframes ;

This is an example on a crude oil  ( CL ) futures 300 Ticks chart :


This is another example on a 9 Range TF ( Russel 2000) Chart


You can get more info about this indicator on the following link


Regards,
Pablo
logo Pablo Maglio The Indicator Store 
Facebook Twitter LinkedIn Blogger Elance