BUILDER :
The Tool to Create NinjaTrader Strategies
NEW ! --> English Video - Video en Español
Click on New, Strategy Builder...


Click Next

Here we define the Custom Series that we are going to use.
By now, we can skip this section and click Next

Now we add the input parameters of the strategy ; Target, Stop, Periods, and input parameters of all the indicators we are planning to use.
Example : If we want to create a Moving Average Crossover, then we need :
- Target
- Stop
- Period of Fast Moving Average
- Period of Slow Moving Average
After adding all the input parameters and variables ( we will cover this on future posts ) we click on Next
On the upper panel we add all the conditions that simulatneously must be true to trigger an action :

On the Lower Panel we add all the Actions that we want to execute when the conditions abover are all true.
Clicking Add on the Upper panel we get the panel to define logics :

The Logic is always composed by 3 sections :
- Left Panel
- Condition
- Right Panel
The panels ( left & right ) can be :
- Indicator : any plot from any indicator
- Price : any part of a bar ( high, low, open, close )
- Strategy : parameters of the strategy like position, Pnl, etc
- Misc : misc functions, like numeric value, etc...
- Time : time related functions, like the time of current bar
- User Input : any of the input paramters we defined at the begining
The condition can be less, greater, and several other combinations.
To detect the Crossover then we place the fast moving average indicator on the left panel, the slow moving average indicator on the right panel, and the condition is cross above :

After adding all the conditions we return to the Conditions & Actions Window

And now we can click on the lower panel Add button to add an action.
An Action can be painting a signal, executing an order, sending an email, playing a sound, etc.
At the begining, before placing orders it is a good practice to just draw a signal to check if it works properly on a chart.
The easiest signal to draw is painting the Background, because it doesnt need coordinates, just the color :

Now, to create the short conditions, we can replicate the logic used for the longs doing right click over the tab "Set 1"

And we get 2 tabs doing exactly the same, so we can edit the logic at the top ( instead of cross Above, use Cross Below ) and the Action at the bottom ( just change the color in this case )

Now that we have the 2 tabs properly configured, one for longs and the other for shorts, and taking into account that we are not placing orders yet, we can click on compile and add the strategy to a chart.
Right clicking a chart we get a menu where we can select Strategies...

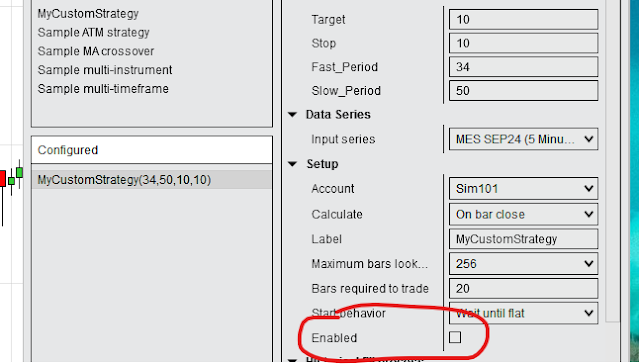
Select the strategy we just created ( MyCustomStrategy ) , conmfigure the parameters ( Target, Stop, Fast_Period, Slow_Period ) and turn on the Enable option :
We get the signals painted on the chart :

If everything is working as expected we can continue adding entry orders, target and stop :
First, select the Tab 1 and click on the add button of the lower panel :
This time we double click "Order Management" and add an EnterLong Order

We do the same on the Tab 2, but adding an Enter Short Order :

Now we can click on Next, where we finish the strategy adding a target and stop :

We map the VAlue of the Target size to the input parameter Target clicking on set

Repeat the process to add a Stop Loss, attached to the input parameter Stop

Now we can click on Next, Finish and refresh the Strategy on the Chart
To refresh a strategy we can right click the chart, select strategies, turn off the enable option, click apply, turn on enable and click on Apply again.
Or, a faster method is clicking twice the Enable option on Control Center, in the Strategies Tab :

Looking at the Chart, now we can see the historical trades.
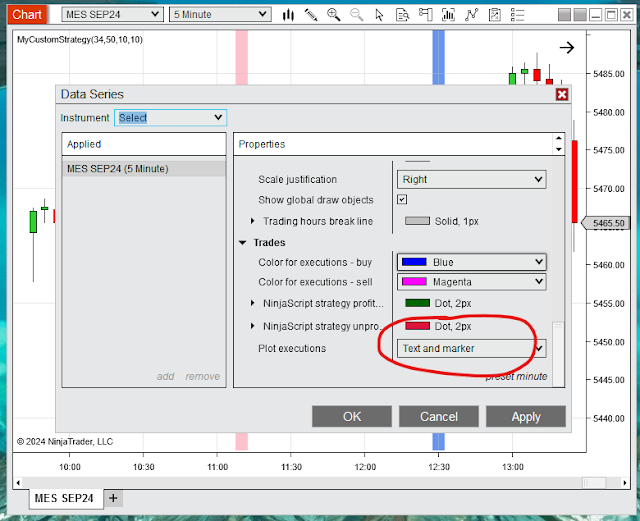
If the trades are not visible, check that you have enabled the plot executions option in your chart : right click the chart, select dataseries and go to the bottom :
If we want to change a parameter, like for example increasing the size of the targets and/or stops, we right click the strategy
And as the strategy is working, the parameters can not be edited, so we click on Enabled to turn it off and then on Apply

( We can also turn off the strategy from Control Center with just 1 click )
Now we can edit the parameters and clik Enable, Apply again :


On following posts I will explain more details about using Builder and Strategy Analyzer.
Please Comment & Share !
Pablo


