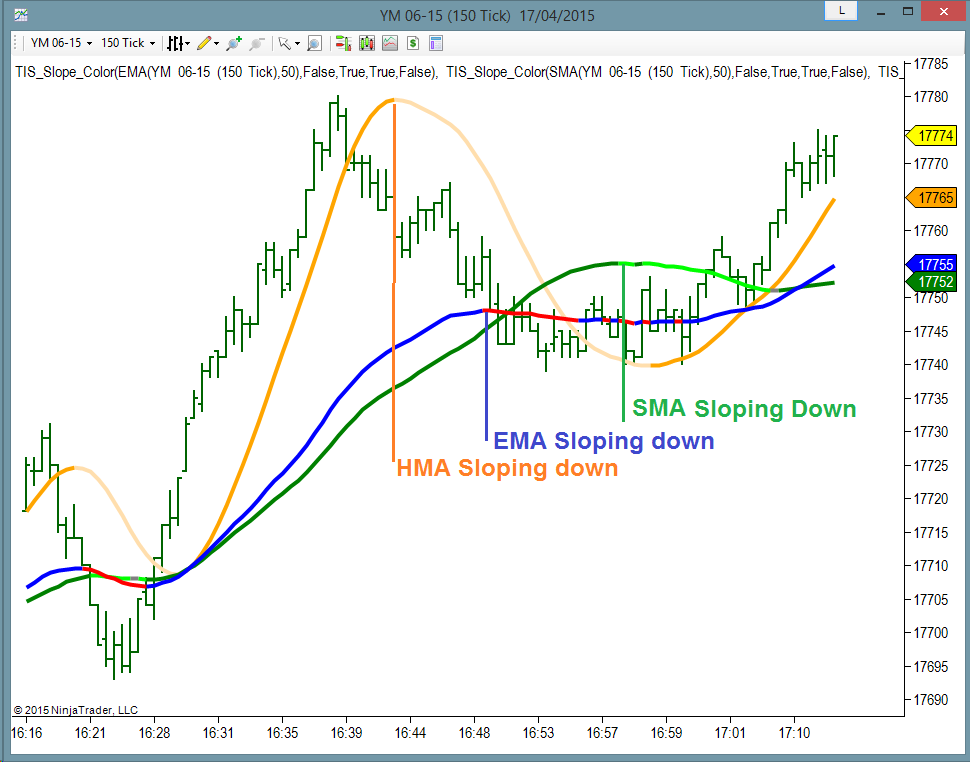
One of the most used techniques to define the Trend of a Market is looking at the Slope of an Indicator.
Usually a Moving Average like HMA, EMA, SMA provide a good idea of the trend, having the first one ( HMA ) the fastest, and the last one ( SMA ) the slowest reaction.
On this Chart we can see an example of 3 Indicators using the same Period :
We can even look at combinations of Indicators to define the trend.
For example, looking at a fast EMA to produce the quickest results may also produce too much signals, most of them not good, as we can see on this Chart :
Here I apply an HMA(8) to get the fastest response :
But to avoid so many signals, we can Average this line, using an EMA(8) of the HMA(8) and it looks like this :
On all type of moving average types, using a small period offers more response, less delay but more fake signals, so it is always a good idea to average the line several times using a small period ; Example : EMA(EMA(Close))
The Donchian Channel is also very useful, it has 3 lines : the upper, the lower and the median ( average between upper and lower ).
On this example I will use the Median of a 12 Bars Donchian:
These example Charts were generated with the TIS_Slope_Color Indicator for Ninjatrader, which allows to detect the Slope of any Indicator or combination of them as seen on this YouTube Video :
Hope you find these basic concepts useful to add or enhance your Trade Setups.
Please share and post any questions !
Best Regards,
Pablo Maglio
 |
 Skype id : pmaglio Skype id : pmaglio |


