Posts

New Markers Plus System for Ninjatrader
Image
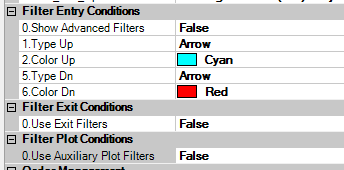
New Markers Plus System for Ninjatrader ( Markers v3 ) Hello Traders ! The New release of the Markers System , version 3 is now called Markers Plus , and includes lot of new features that let the trader create its own trade setup as we will describe on this post. As explained on the previous article , Markers detects an object painted on the Chart and Executes an ATM Order if that object meets our criteria. It is also possible to close a position if a particular object is detected. Examples of Use Going Long on a Cyan Arrow and Short on a Red Arrow Same as before but Closing Positions at Orange Diamonds It is possible to define a Time Trading Window ( useful for automating a setup ) Setting the trading time to trade only from 8:45 AM to 3:45 PM ( note that time is in 24 hours format including seconds : HHMMSS ) Settings to trade the night from 11PM to 2 AM The Markers Plus System places a ToolBar on the Chart that allows the user to Enabl...

Using the Slope of an Indicator to define the Trend

Image
Using the Slope of an Indicator to define the Trend One of the most used techniques to define the Trend of a Market is looking at the Slope of an Indicator. Usually a Moving Average like HMA, EMA, SMA provide a good idea of the trend, having the first one ( HMA ) the fastest, and the last one ( SMA ) the slowest reaction. On this Chart we can see an example of 3 Indicators using the same Period : If we look at the Trend Changes, then the signals on each Indicator happens on the shown points : We can even look at combinations of Indicators to define the trend. For example, looking at a fast EMA to produce the quickest results may also produce too much signals, most of them not good, as we can see on this Chart : Here I apply an HMA(8) to get the fastest response : But to avoid so many signals, we can Average this line, using an EMA(8) of the HMA(8) and it looks like this : On all type of moving average types, using a small period offers more response, less del...

Defining a Trade Setup using Crossovers with Ninjatrader

Image
Hello Traders ! Today we are reviewing several Indicators that can be used to define a Crossover Trade Setup. There are some Indicators that produce only one line, like EMA, SMA, HMA, etc. Then we can use 2 Instances of same Indicator with different settings and check its Crossovers. Examples :  Crossovers of an EMA(14) vs EMA(7) Note : The places where the Blue Line crosses above the Cyan Line there is a Long Entry Signal. Where the Blue Line crosses below the Cyan Line there is a Short Entry Signal. On these type of Setups the Best Results can be obtained with faster Indicators like the HMA.  The HMA produces faster and less lagged results as we can see on this Chart Crossovers between an HMA(26) and an HMA(12) : Note : On this example the Crossovers are indicated with Arrows using the Custom Indicator TIS_HMA_XO The Entry Signals produced by the TIS_HMA_XO Indicator can be automated using the The Markers System . Some other Indicato...

Managing Multiple Positions on Ninjatrader

Image
Managing Multiple Positions on Ninjatrader allows to be Long and Short at Same time When we follow more than one Setup on an Instrument, it is possible that we may need to trade an Instrument which is already being traded. Usually we have different Setups on Different Charts for each Setup we Follow, but when we trade the same instrument multiple times on same account we get mixed orders making the analysis of each setup confuse. Let see on the following pictures how can we manage that situation on Ninjatrader using the Chart Trader : On this Chart we can see an example of a Long Trade of 1 contract with its corresponding ATM Stop and Target  Later, following a different Setup from other Chart we decide to Enter Short also 1 contract, so the net result would be flat. And we get the same mixed orders and positions on all Charts ( assuming we are trading both setups on same Account ) On this picture we can see that there is no position and targets above and ...