This combo includes :
- Indicator TIS_ATR_Trend ( for Tradingview )
- Signal Automator ( for Tradingview )

Follow us for more info at our Chat Room on Discord : The Indicator Store Chat Room
At the Channel : #tradingview
This combo includes :
Follow us for more info at our Chat Room on Discord : The Indicator Store Chat Room
At the Channel : #tradingview

This setup is the confluence of 2 different Trade Setups :
Setup #1 : Darvas

When the price crosses one of the lines it is a signal.
The only special consideration about this indicator is that it redraws, so what we see on the Chart is not what is visible real time, but once the box is drawn in real time, if the price breaks it we have a signal.
This system has no parameters, so the only variable we have is the timeframe, and also it is suggested to filter it with some other tool, as we are doing here.
Setup #2 : Squeeze


If you are looking for an indicator to define the Trend that adapts to different market conditions, the TIS_ATR_Trend is the ...
Best Trend Indicator for NinjaTrader 8.
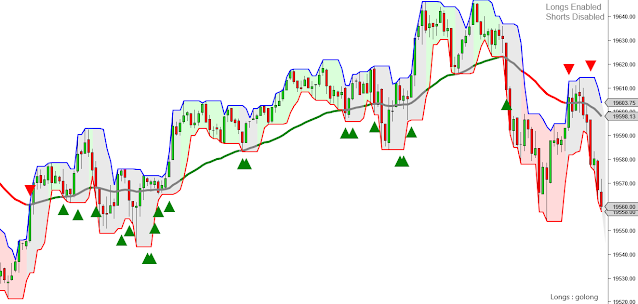
This is how the indicator looks on UniRenko using the fastest settings :

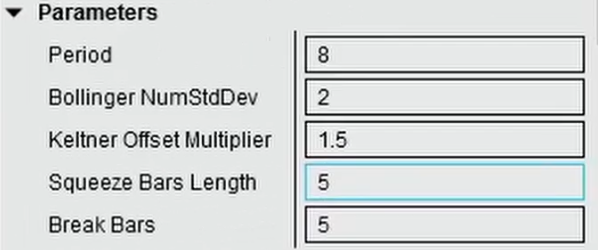
These are the indicator parameters :

With the ATR Multiplier we can adjust the sensibility to change the trend, here we have an example using a value of 1


Here we have an example without filter but with an ATR multiplier of 2


I will post here a YouTube Video as soon it is loaded :
Pablo


How to use the MACD
A comparisson with the Awesome Oscillator.
1) What is a MACD ?
The MACD Indicator has 3 lines, so lets go one by one :
MACD = Distance between 2 Exponential Moving Averages : EMA(Fast)-EMA(Slow)
Average = an average of the MACD line : EMA(MACD,Smooth)
Diff = Distance between the MACD and its Average : MACD - Avg

That means that when the MACD crosses the zero, both moving averages are crossing.
By the sign of the MACD we can also detect if the Fast Moving Average is above or Below the Slow Moving Average. This is a method to define if the Market is going up or down.
As a comparisson, the Wiseman Awesome Oscillator does exactly the same but with SMA's instead of EMA's, and the periods are fixed to 5 & 34

The Awesome Oscillator has only one line, the equivalent to the MACD, but the MACD has another two lines :

This line is sometimes useful to create the EMA Crossover Signals, because with the Smooth Period we can decrease the noise, and fake signals.
The last line is the Diff, or Difference, the classic histogram.
This line is the distance between the Macd and its Average.
So, we can detect the crossover between the Macd and its Average by looking at the crosses by zero of the Diff.
This cross represents the moment when the two lines (Fast & Slow EMA's) stop moving away from each other and start coming closer together.
So, its an early signal of a possible moving average crossover
Possible Trade Setups
1) EMA(Fast) Cross EMA(Slow)
We can use the Avg of MACD(Fast, Slow, Smooth) detecting when it crosses the zero
2) MACD Pullback Continuation

This setup consists of detecting the moment when the distance between the fast and slow averages begins to increase after having been decreasing but without going below zero for a Long Signal.
Similarly, the moment when the distance between the fast and slow averages begins to increase after having been decreasing but without passing above zero are now Short Signals :

Watch the related Video :